The Geography of Cannabis, 1910-1919
Click on the map to view in Tableau where you can manipulate the variables yourself (user guide here)
Introduction
Geography is another variable of considerable importance in the cannabis historiography, particularly in relation to the question of why certain states (and even the federal government) prohibited cannabis when they did. In 1970, Harry Anslinger explained to David Musto that during the 1930s the federal government was consistently alerted to the danger of cannabis by police and prosecuting attorneys from the Southwestern states and this, he claimed, is why the federal government acted to prohibit marijuana when it did. In 1974 Richard Bonnie and Charles Whitebread argued that, on the state level, marijuana prohibitions had followed in the wake of Mexican immigration, beginning near the border and flowing north. As noted in the previous post, that hypothesis has since come under fire from scholars, beginning with Dale Gieringer in 1999 who argued that California’s 1913 prohibition had not been driven by fear of Mexicans despite their presence there. More recently Adam Rathge, and then George Fisher, have told a similar story about New England where cannabis was not widely used as an intoxicant, but its reputation as one was sufficient to get it included in various Progressive Era drug-control laws. Rathge has also highlighted the crucial role that New Orleans played in shaping cannabis discourses throughout the country.[1]
While our data here is not specific enough to fully explain local prohibitions, we can explore variations in the cannabis discourse by geographic area. For example, were negative portrayals of cannabis more prominent in one section of the country over another? Were certain effects more likely to be reported in one area rather than another? We can also consider variations in demographics by geographic section, and so forth.
Methodology
As usual, we’ll begin with a few notes on methodology.
First, keep in mind that our data primarily reflects the nature of cannabis discourses in the United States in the 1910s rather than the reality of cannabis during that time. Of course the way this drug was written about and understood was vital to its movement through the actual historical spaces of the period, shaping the laws that were developed to control its use and even the way the effects of the drug were experienced.[2] So understanding the nature of that discourse is vital for understanding the development of these laws even if in this project we can’t say much that is definitive about the latter. As with the other elements of this story we have studied so far, the hope is that these visualizations may inspire further research.
Second, as explained in an earlier post, Chronicling America’s newspaper collection is geographically uneven. For some states, there were upwards of 16,000 available newspaper issues for the years we studied. For others, there were only a few hundred. Luckily some of our key states, like Texas, are extremely well represented, but other states of interest, like Massachusetts and California, were less so as we can see here:

Click on the image for a better view in Tableau
To account for this discrepancy, we created a “normalization” toggle on all of the geographic visualizations, including the map, so that you can view the raw numbers or view the proportion of total issues available that fulfills whatever criteria we are looking at (see “Tip 2” here for more on this). Thus, for example, there were only 2 articles from Maine that used the word “hashish” as a primary term for cannabis. However, Maine is also relatively underrepresented in the total corpus, with only 1,103 total issues for the period under study in comparison to, say, Texas, that had 15,333. As a result, while Texas had more articles in the corpus that used “hashish” as a primary term for cannabis (12), this was a smaller percentage of the total issues available for Texas in comparison to the same numbers for Maine. Thus if you look at a visualization utilizing the raw numbers, Texas’s share is obviously larger, but, when normalized, Maine’s share looks larger than Texas’ because just under .2% (.0018) of the total issues from Maine fit this criteria whereas fewer than .08 % (.00078) of the issues from Texas did. For the examples below, we will always be using the “normalized” version of the map.
Third, the interactive map allows you to check off boxes to create a custom visualization that highlights your own chosen criteria. For example, if you’d like to see where the word “hashish” appeared in connection to “negative” descriptions of cannabis’ effects, you could check those two boxes and see the results. We will go through similar examples below and I will paste images of those results, but, as always, you’ll get a much better look if you view it in Tableau, and you can then of course manipulate the visualization on your own or explore new ones of your own design. For some other tips on using the interactive map, click here.
Finally, as I note in the tips to utilizing the map, the size of the dots on the map are not static from visualization to visualization. Instead their size is relative to the data for the other cities and states for that particular visualization. Thus, for example, there were just 12 articles in Texas that used the term “hashish” as a primary term for cannabis, while there were nearly twelve times as many (139) that used the word “marihuana.” But if you manipulate the map to view only the hashish stories, and then, in a separate visualization, do the same for marihuana stories alone, the marihuana dot in Texas is not twelve times larger than the hashish dot on the other visualization. Again, the dots are in proportion to the results of the other cities and states within each visualization, not between them.
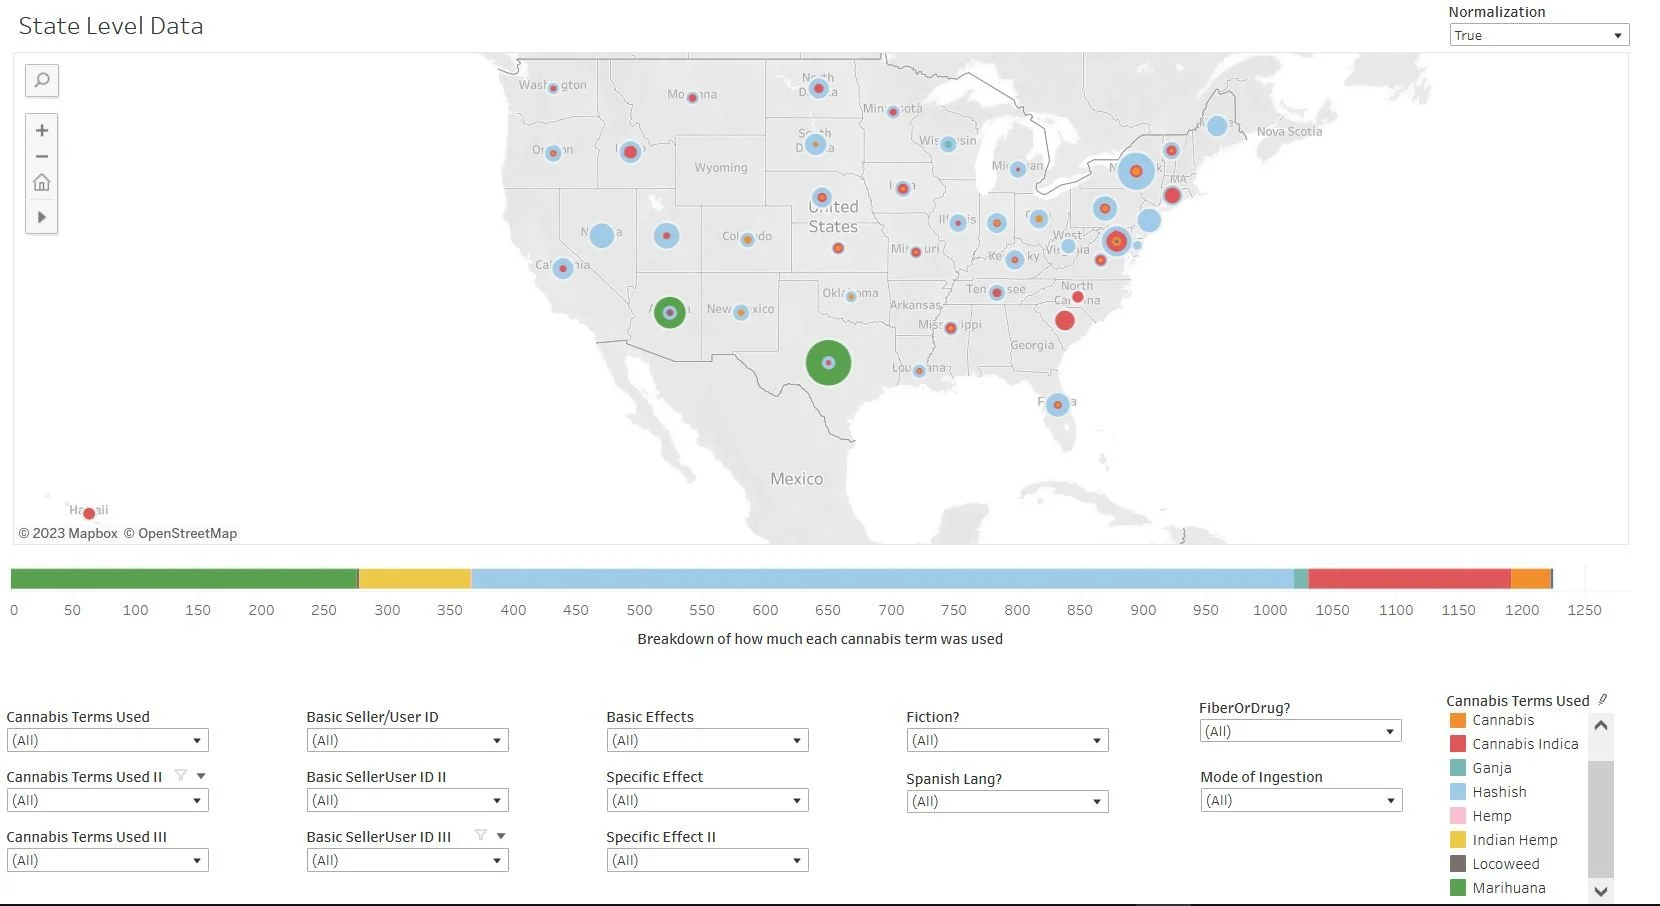
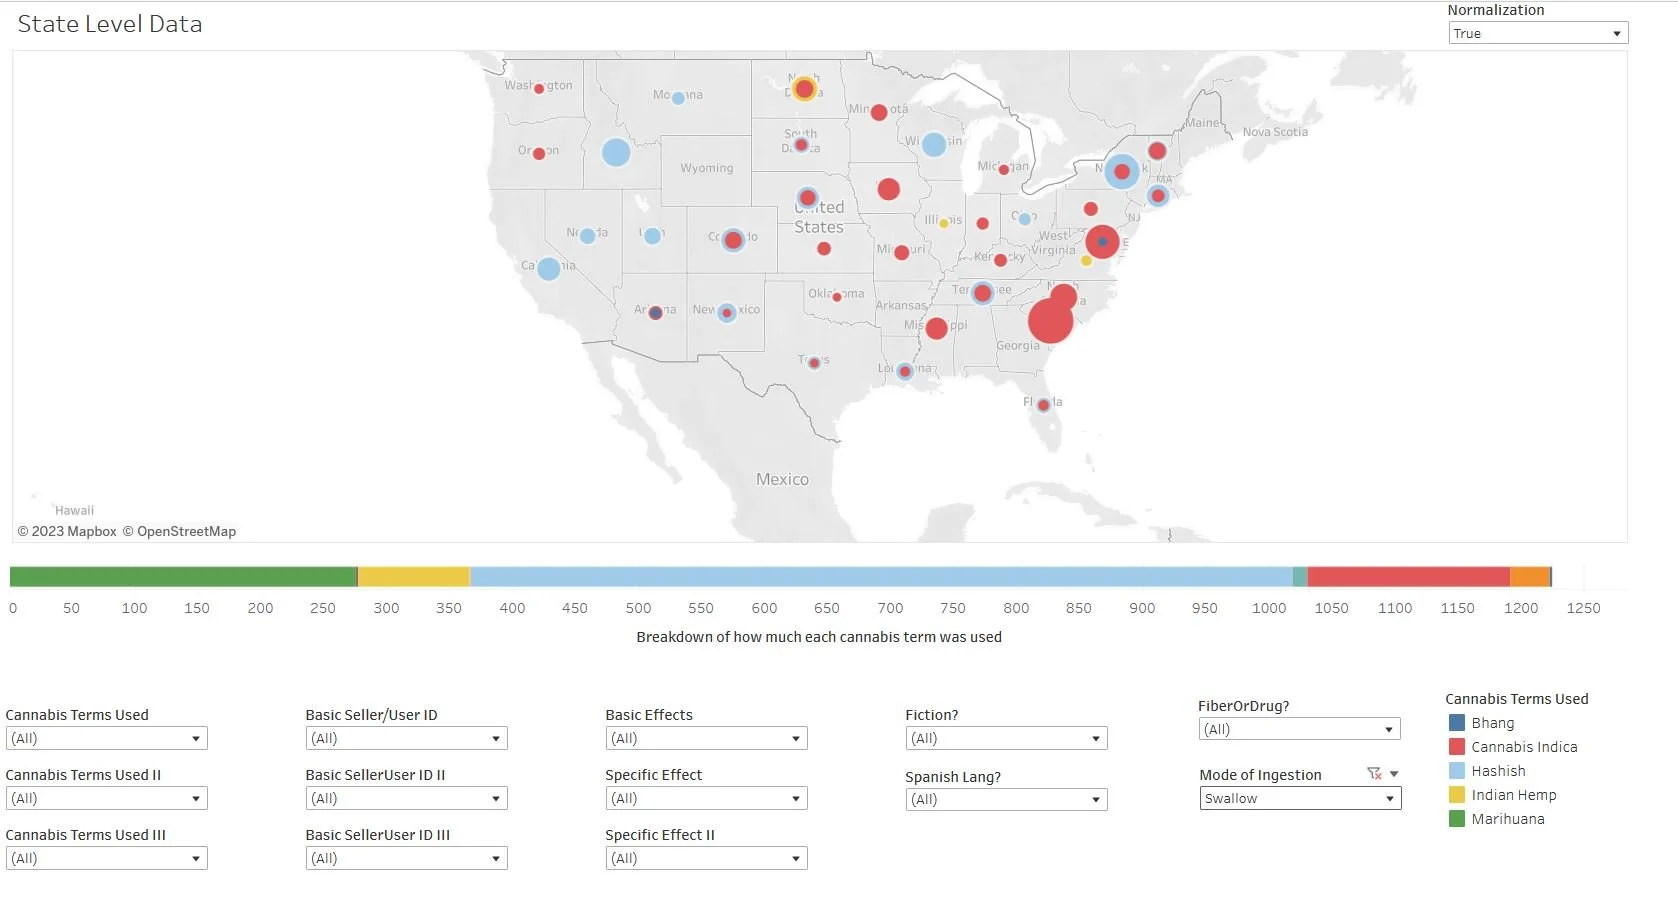
State-Level Data
Let’s begin our look at the data on the state level.
Click on the map to view in Tableau where you can manipulate the variables yourself (user guide here)
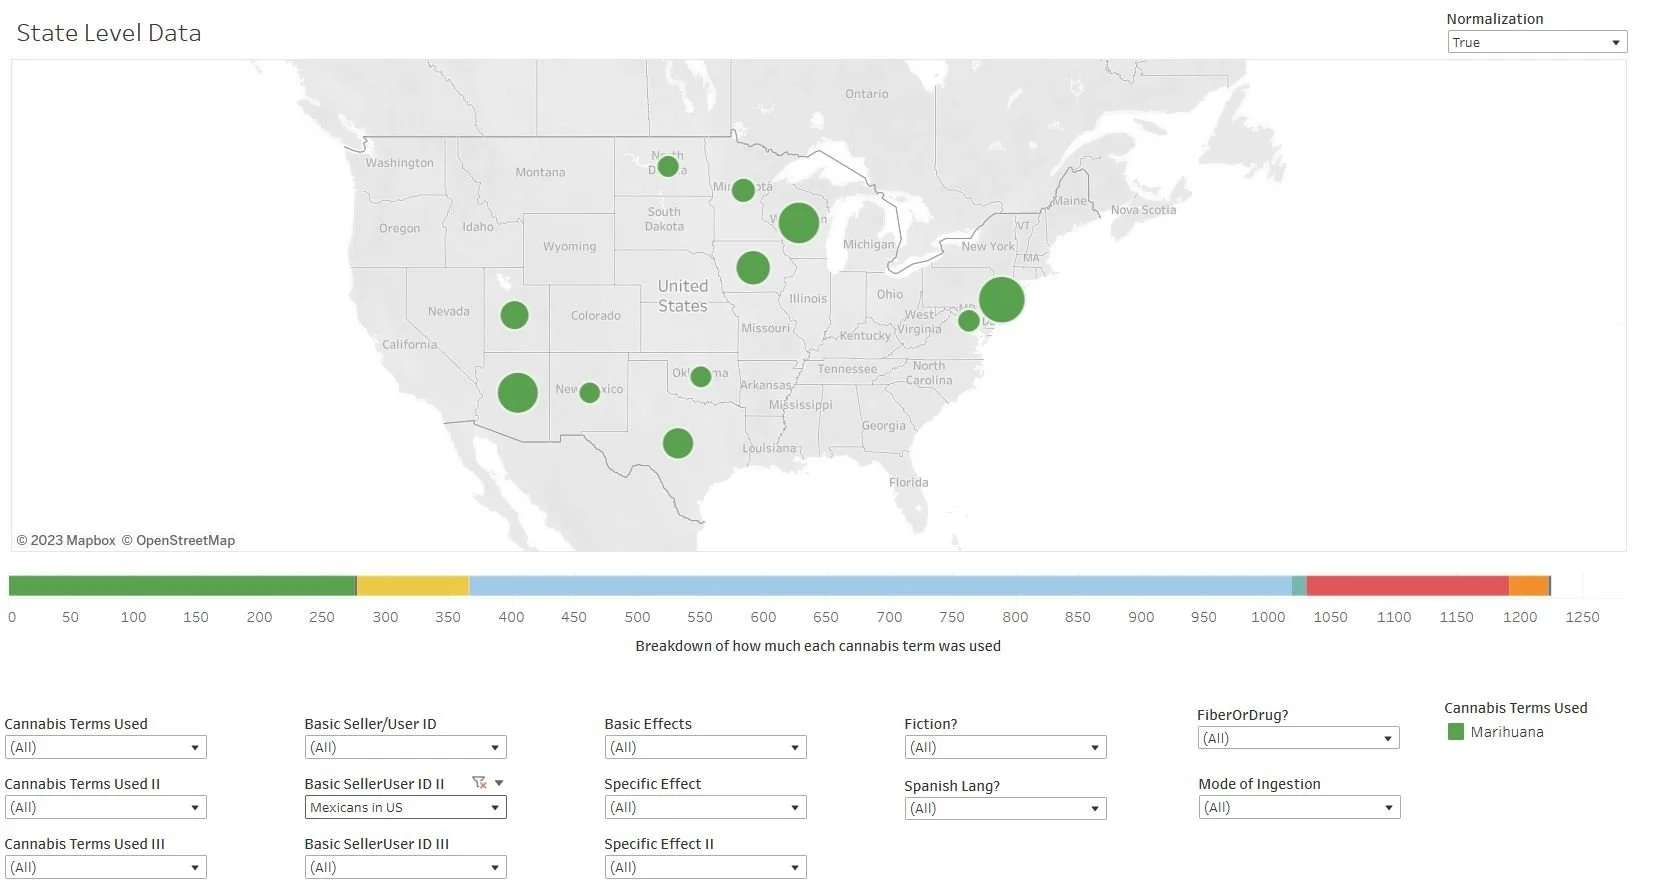
At the most basic level, the map suggests a relatively wide distribution of cannabis stories with a few major hotspots: Arizona and Texas for “marihuana” stories (in green), and Washington, D.C. and New York for “hashish” stories (in blue).
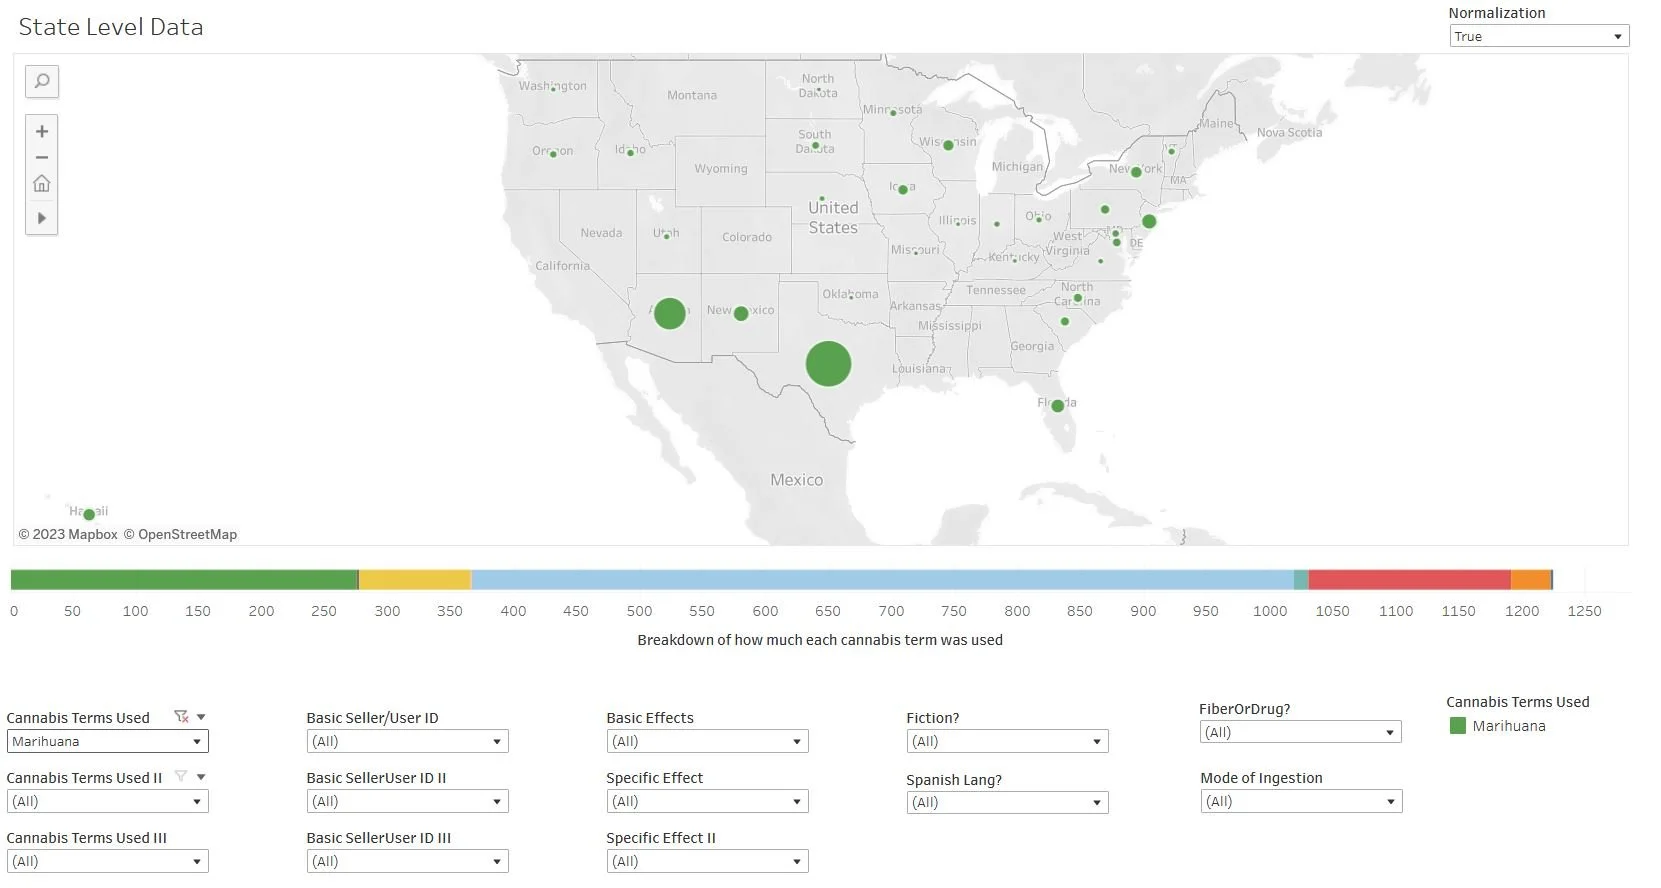
Here are the “marihuana” articles alone:
Click on the map to view in Tableau where you can manipulate the variables yourself (user guide here)
While the word “marihuana” was beginning to appear outside of the Southwest, it was only there that it was relatively common in the press during the 1910s (and the chronology is even more specific as we’ll see below). In many of these other states there were just one or two articles in the corpus over the course of the decade that used the word. Thus, while it was clearly becoming known elsewhere, it’s safe to say that many Americans were either not yet, or only just becoming familiar with the term. Below we will see in the city-level data that there is still more nuance to this, but for now we will just stick to the state level.
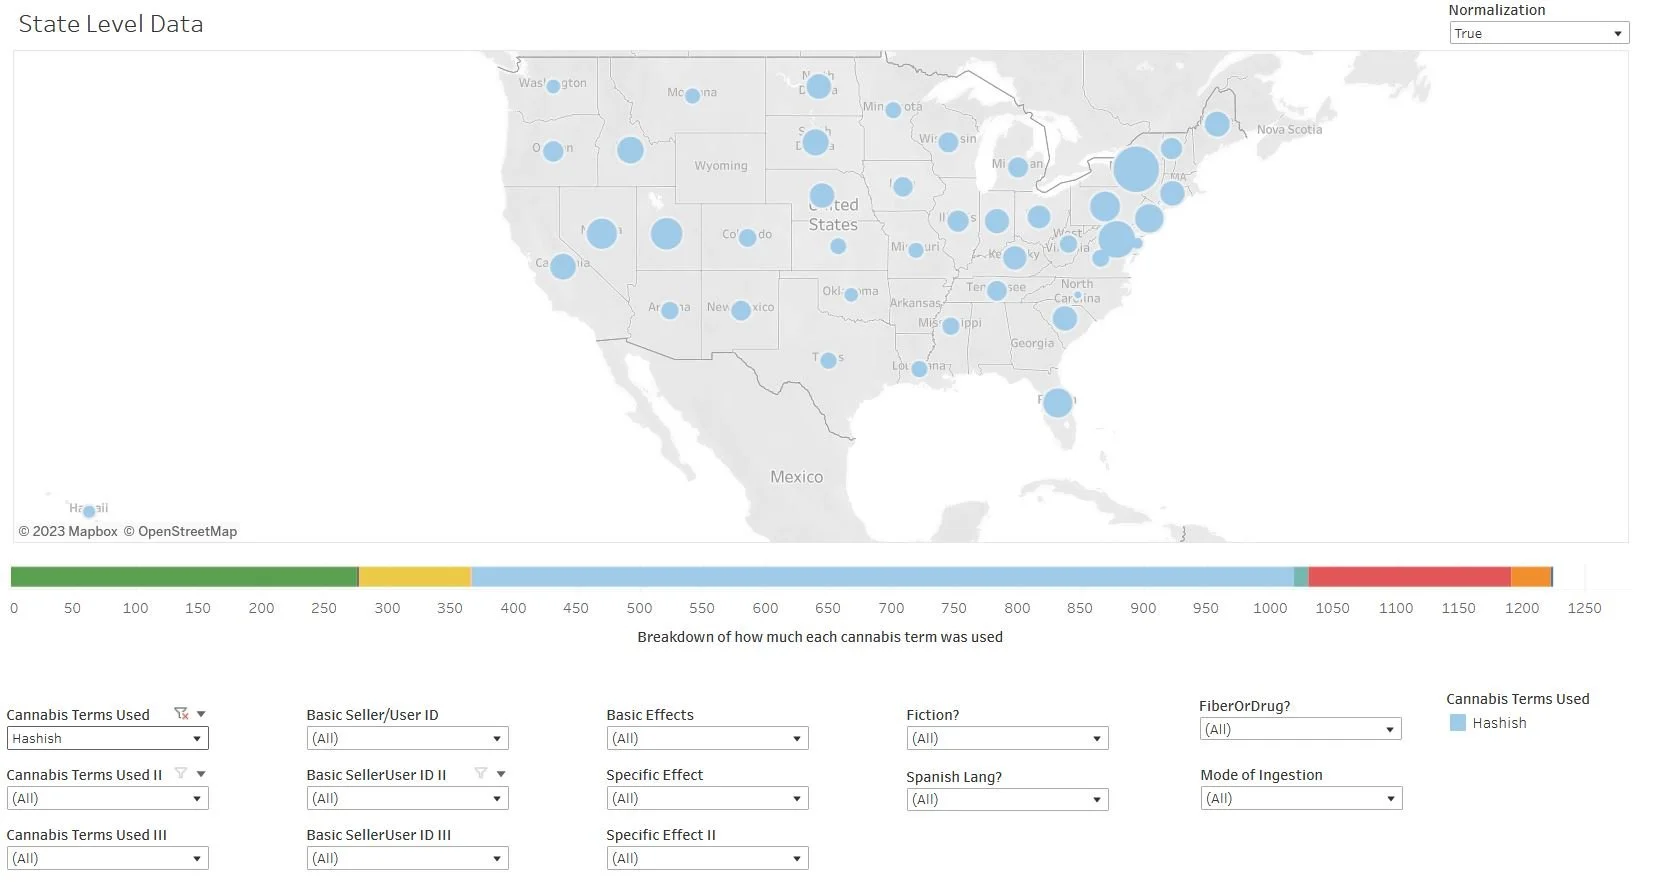
Let’s then compare this to “hashish” which clearly had a wider distribution but also had its own hotspots:
Click on the map to view in Tableau where you can manipulate the variables yourself (user guide here)
“Cannabis Indica” provides a useful comparison, demonstrating that, like hashish, its use as a term for cannabis was relatively evenly distributed throughout the country:
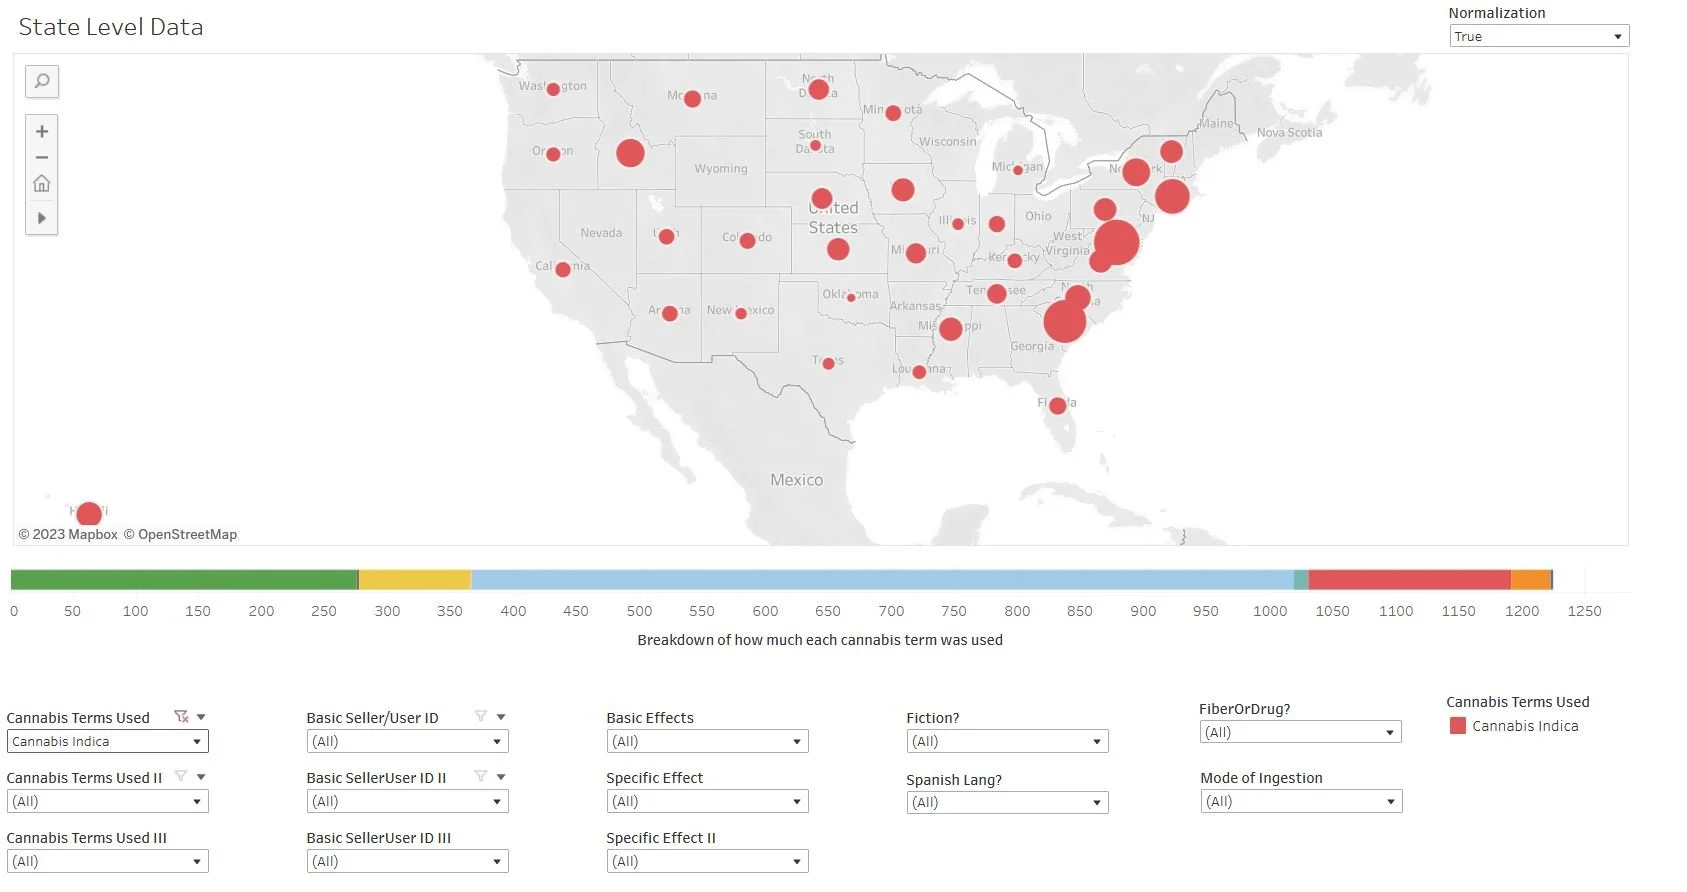
Click on the map to view in Tableau where you can manipulate the variables yourself (user guide here)
“Indian hemp” tells a similar story:
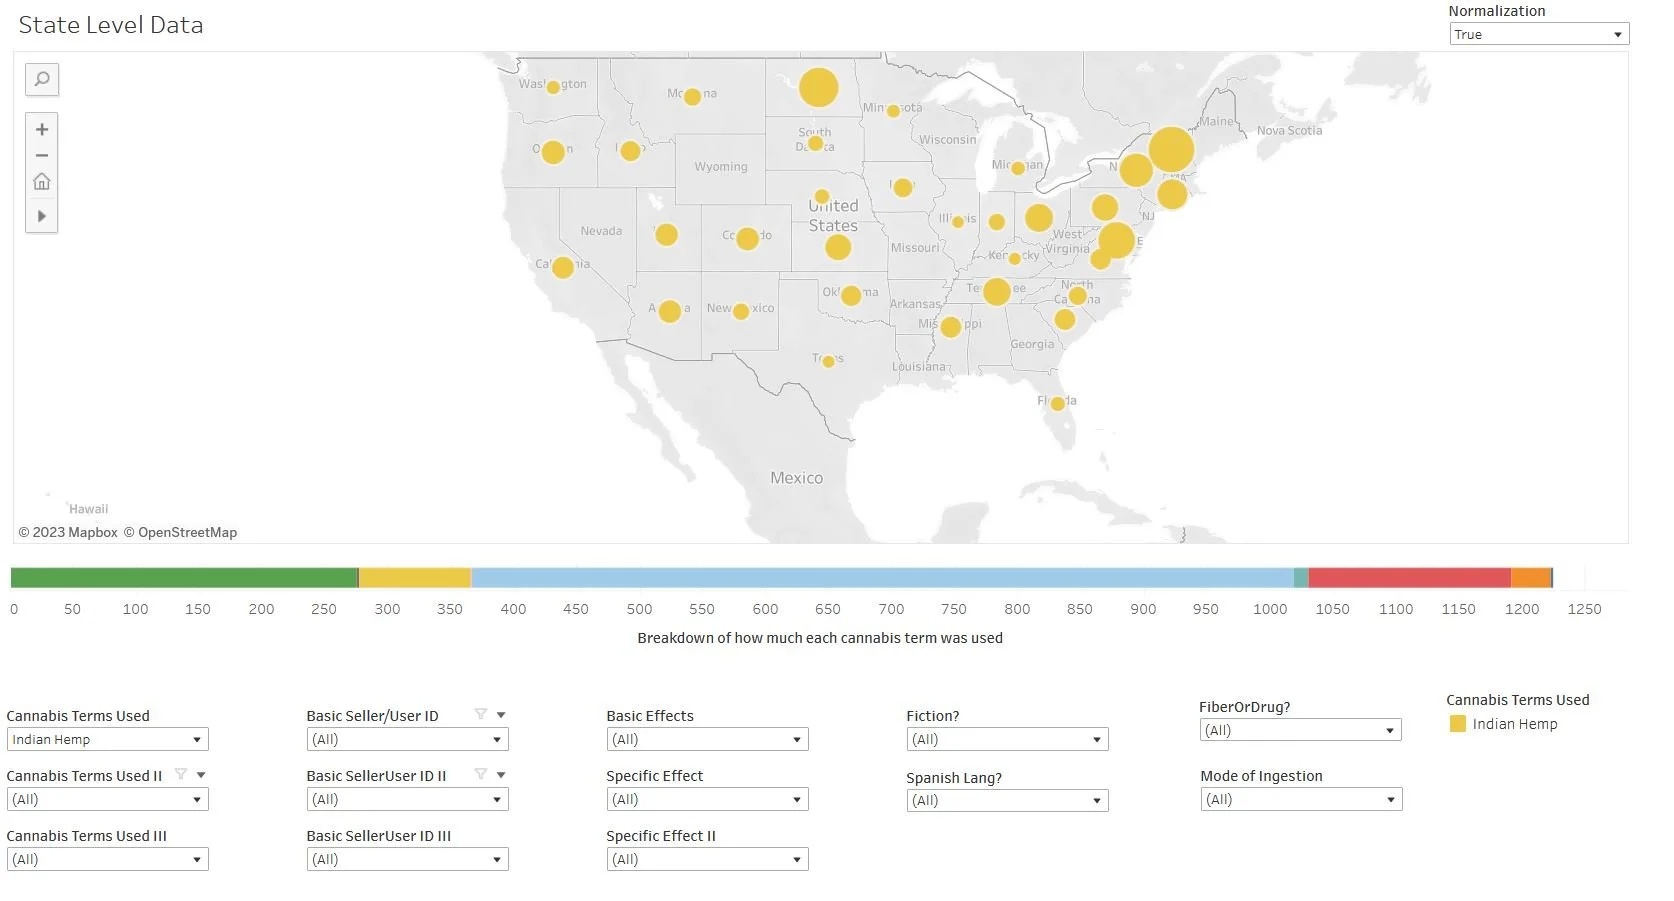
Click on the map to view in Tableau where you can manipulate the variables yourself (user guide here)
Meanwhile “hemp,” which we categorized mostly as a secondary term (and thus it shows up here in the colors of whatever primary term it followed), was again relatively well distributed and, as we can see here, mostly tied to the word “hashish” which was the most likely term to appear in the corpus.
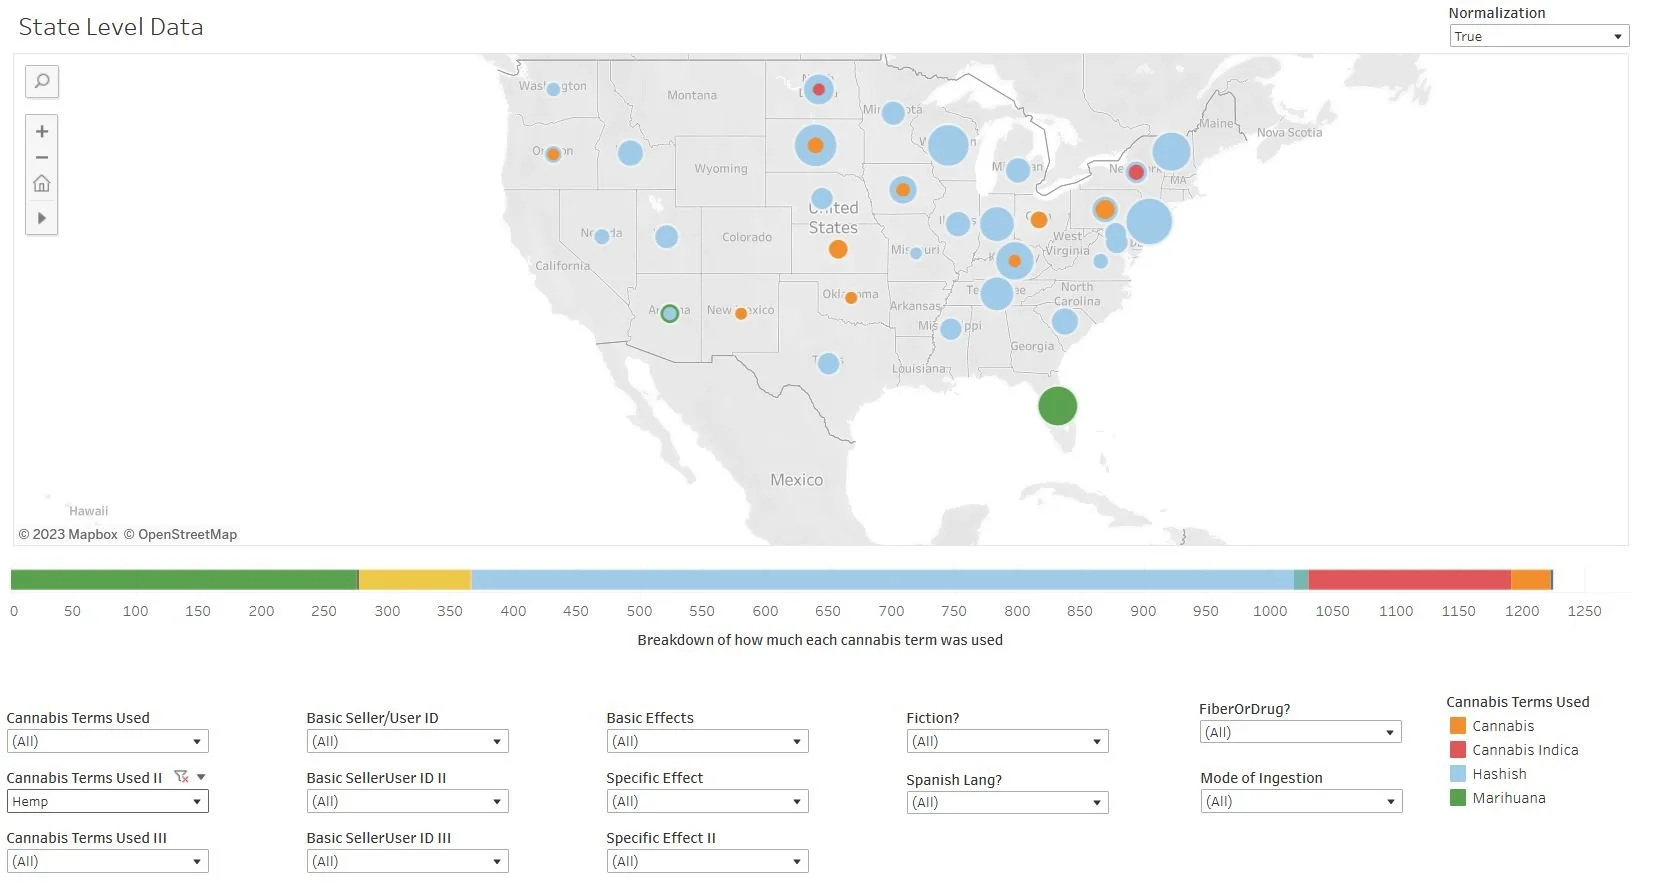
Click on the map to view in Tableau where you can manipulate the variables yourself (user guide here)
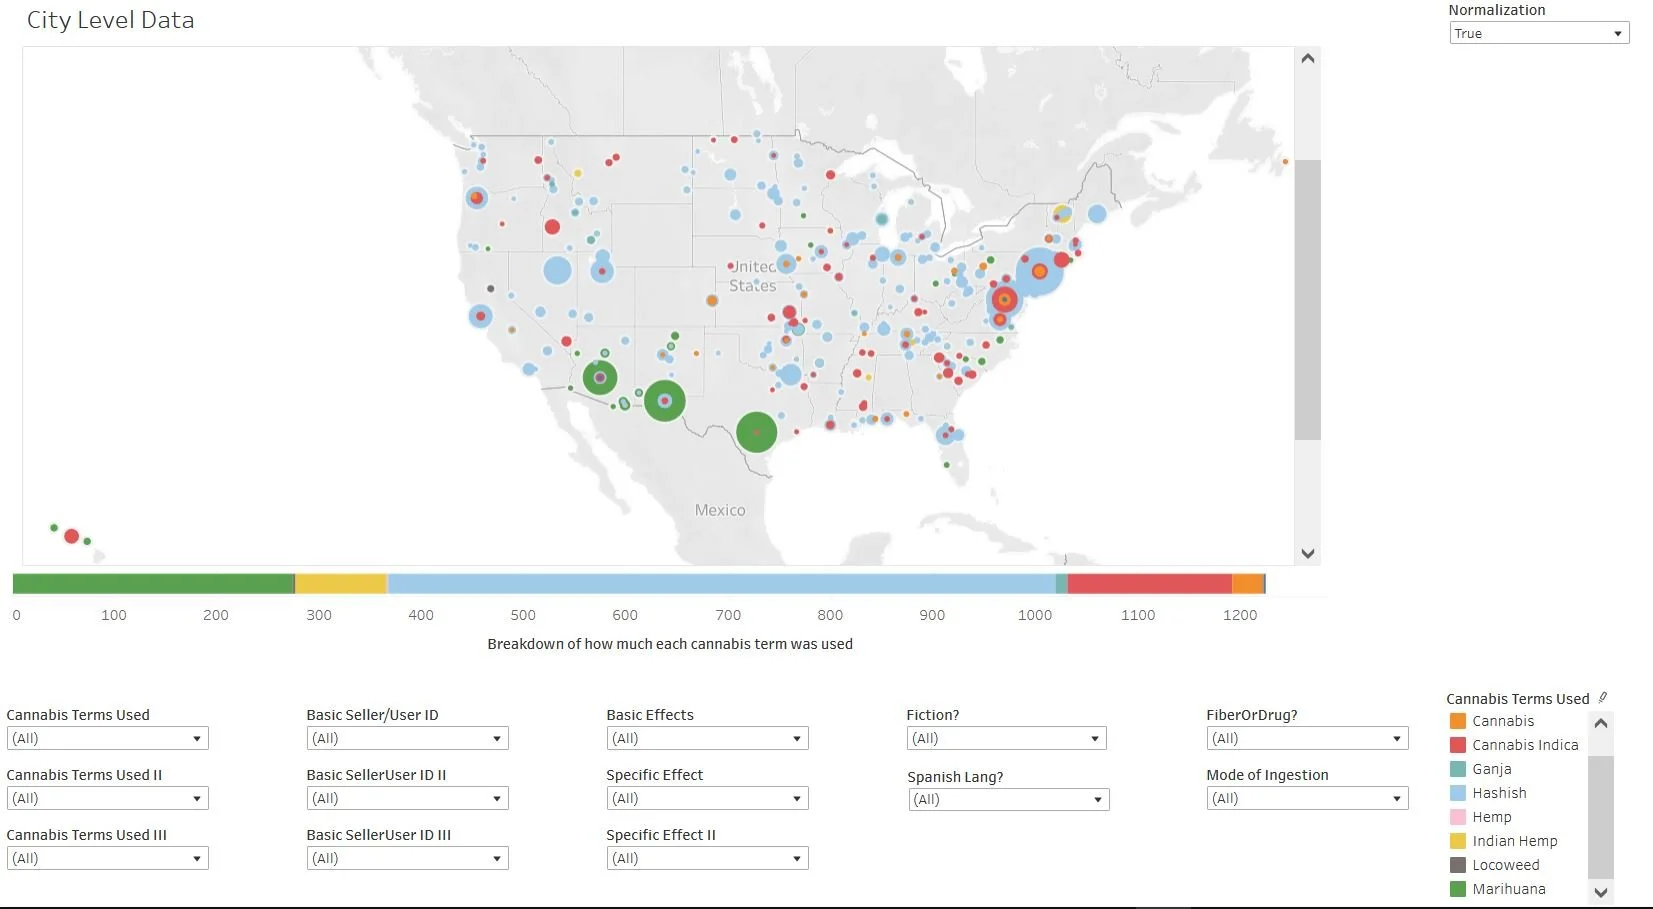
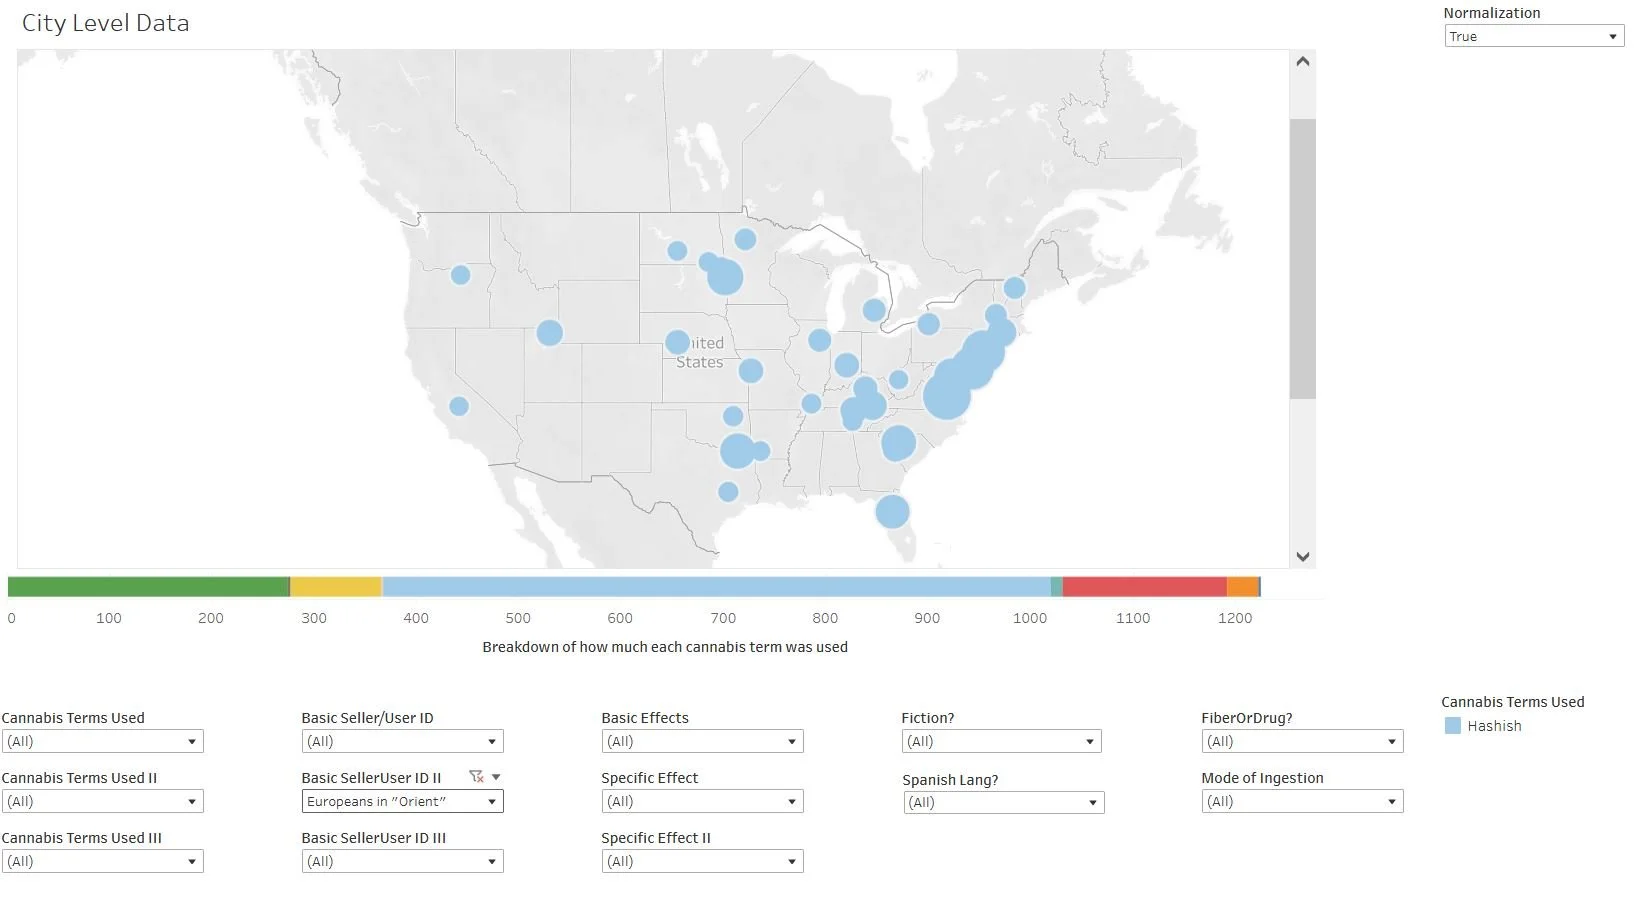
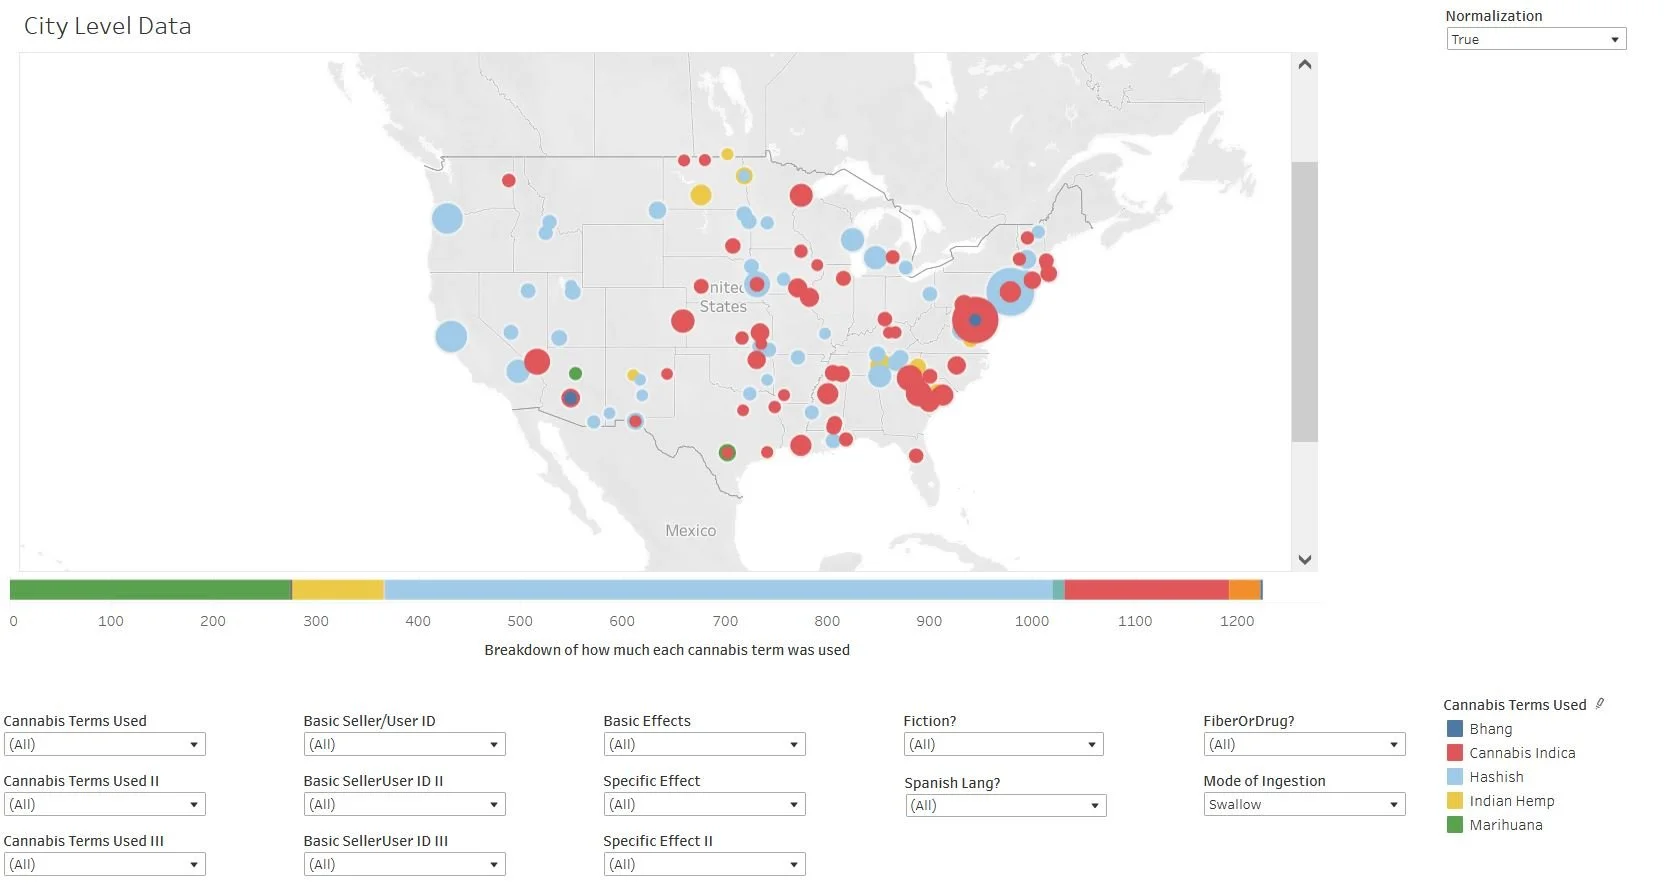
City-Level Data
The data becomes even more interesting if we break it down at the city level. First, let’s consider the city-level map as a whole where we see that the hotspots in both the southwest and northeast are even more conspicuous:

Click on the map to view in Tableau where you can manipulate the variables yourself (user guide here)
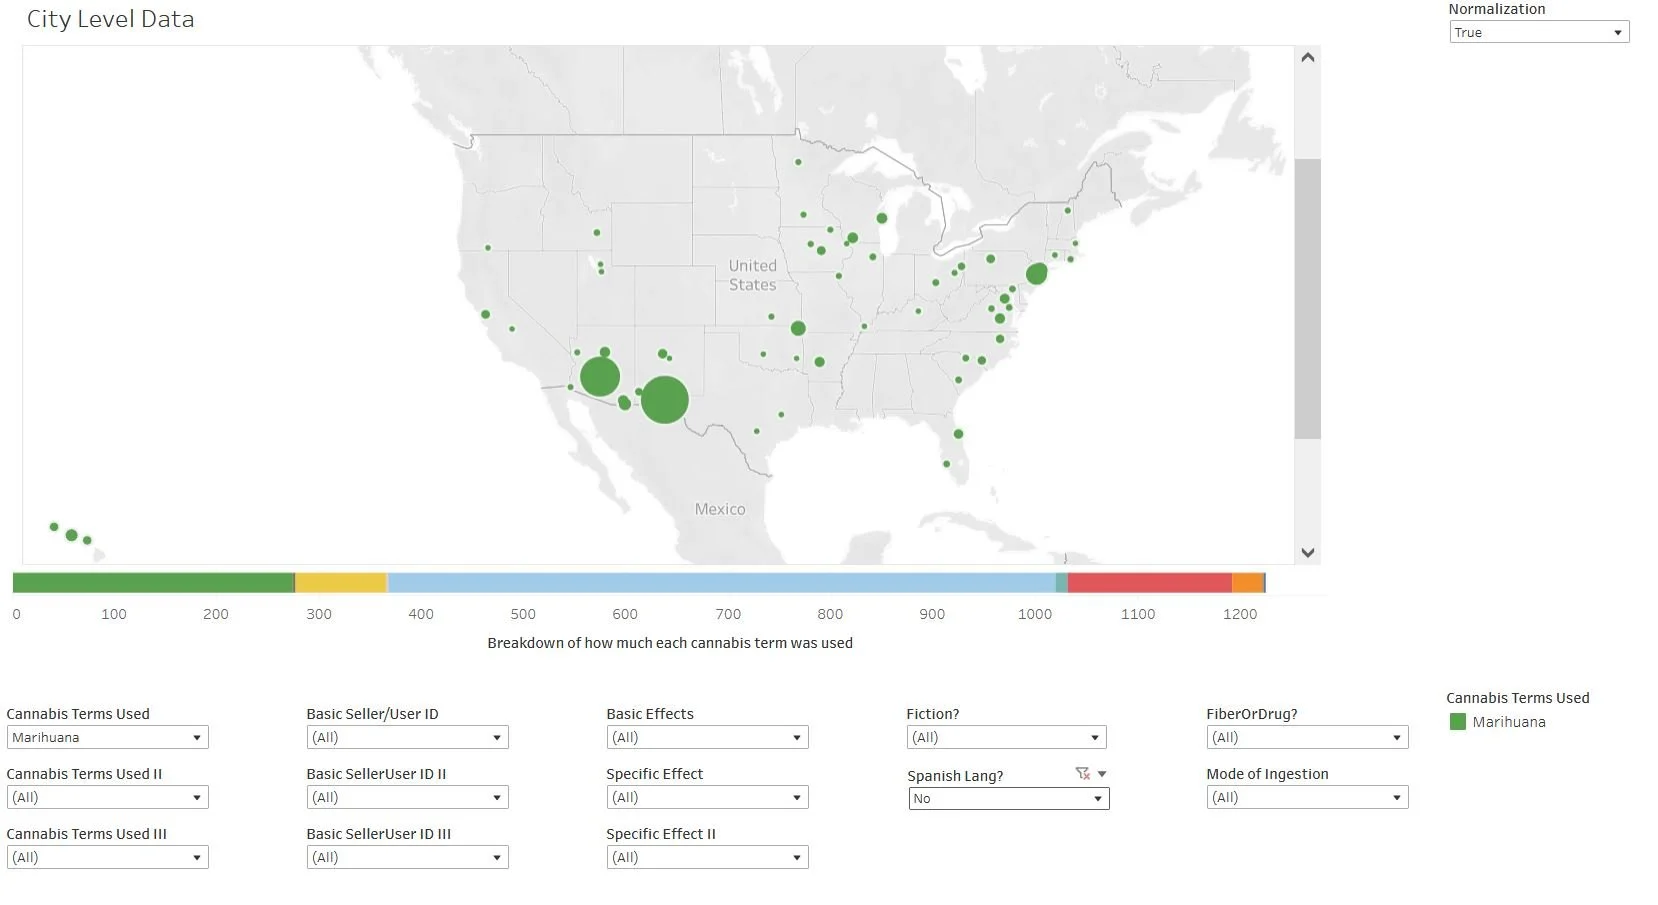
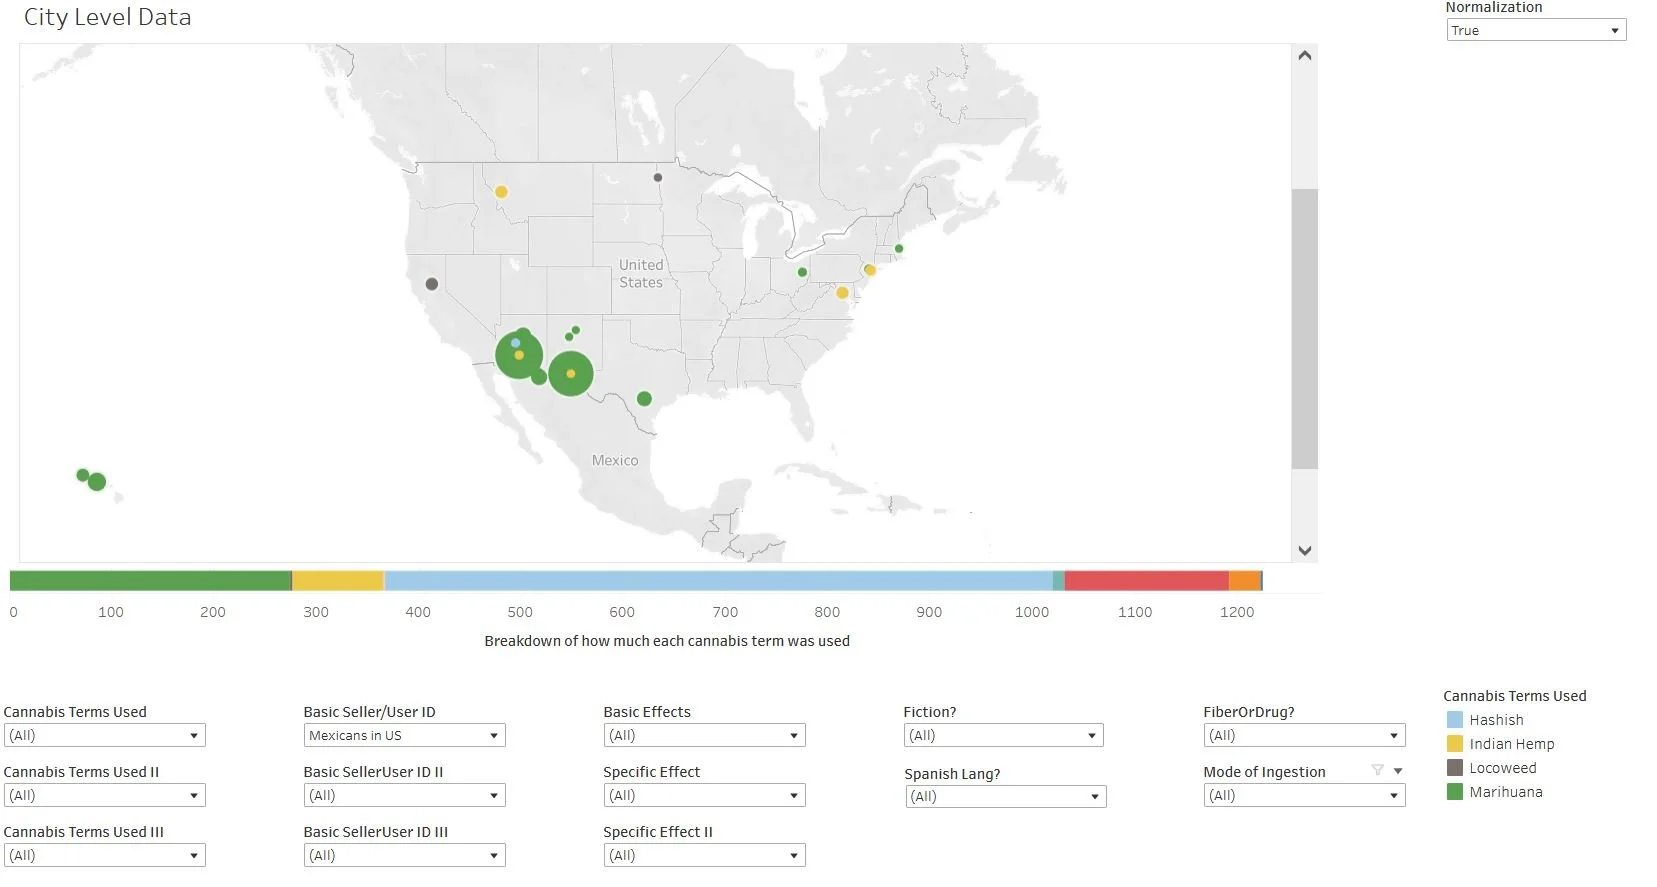
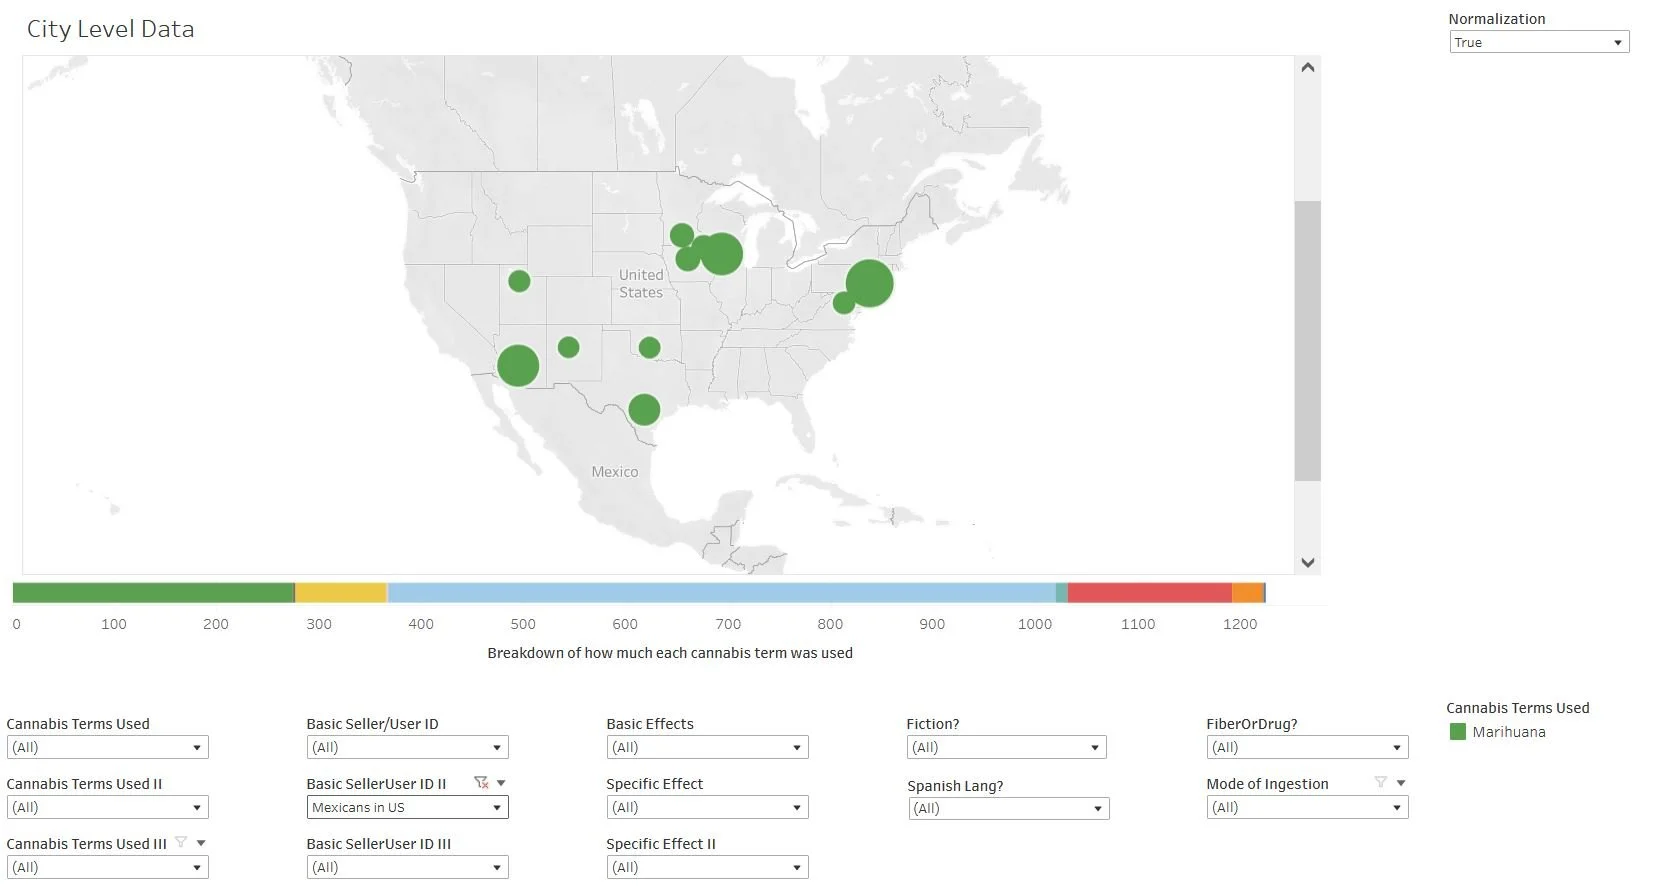
For marijuana this pattern is particularly interesting:
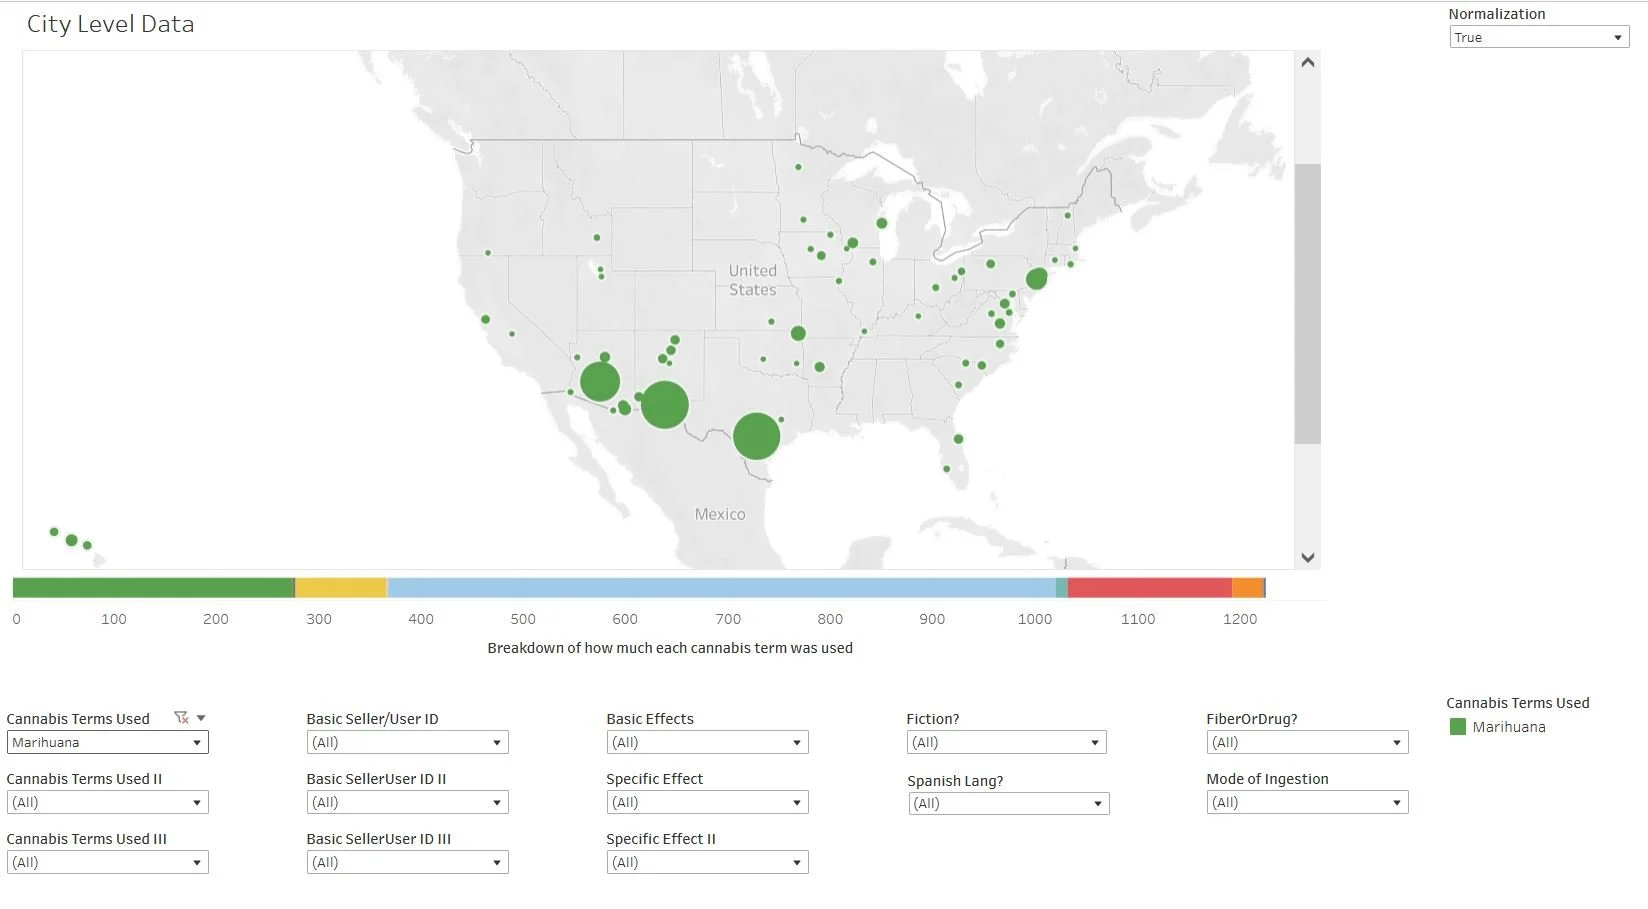
Click on the map to view in Tableau where you can manipulate the variables yourself (user guide here)
Notice how the Texas marihuana articles are nearly all concentrated in El Paso and San Antonio, while those in Arizona are overwhelmingly in Phoenix. Though, as we saw in an earlier post, if we eliminate Spanish-language stories which were mostly from La Prensa in San Antonio (which of course used the Spanish word “marihuana” in all of its stories on intoxicant cannabis), the concentration is even more stark, with San Antonio almost disappearing.
Click on the map to view in Tableau where you can manipulate the variables yourself (user guide here)
Now this concentration could conceivably be a sampling error, but I strongly suspect that it is not. Today there are 17,634 Texas newspaper issues in the collection for the years 1910-1919 with 3,048 of these coming from the El Paso Herald which is where all of our El Paso stories came from. In Arizona, all the stories came from the Arizona Republican (3,593 issues) out of 15,533. So while these major papers represent a rather larger proportion of the total issue count for each state (17% in the case of El Paso; 23% in the case of Phoenix), it’s clearly not enough to account for the wild over-representation of each of these cities in the “marihuana” stories.
The El Paso information is not surprising. I have noted elsewhere (pages 25-29) that El Paso was an outlier in the region in both commerce in marijuana and concern about it, and have hypothesized that this may have been due to it supplying users on both sides of the border. The Phoenix case, as far as I know, is a new revelation. Phoenix has not been cited in the literature as a significant hotbed of marijuana use or commerce. This is another story that could benefit from further investigation by an intrepid researcher out there.
And, as noted in an earlier post, there’s a chronological element to coverage of “marihuana” in these outlying cities. Here are the two key visualizations once again, showing not only that Phoenix, El Paso, and San Antonio were outliers in their respective states, but that coverage in both Phoenix and San Antonio did not really increase until 1916. First Arizona:

Click on the image for a better view in Tableau
And then Texas:

Click on the image for a better view in Tableau
Mapping Cannabis Effects
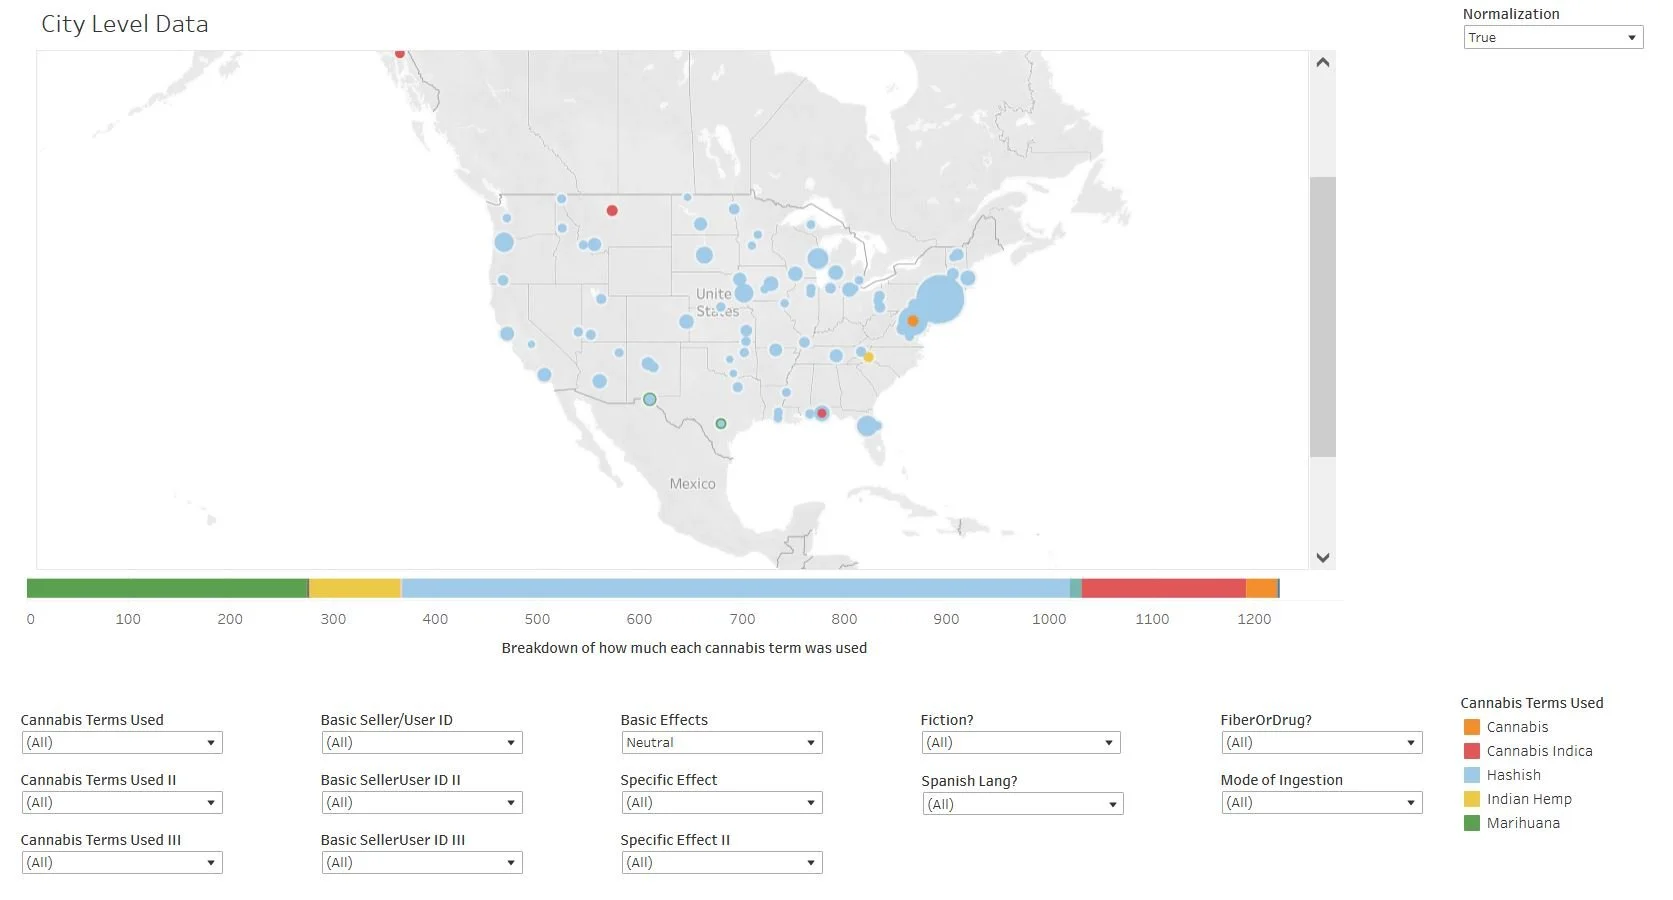
Next we ask if the reported effects of cannabis varied from region to region. Let’s take a look at this data first without the map so as to get a feel for the proportions of positive versus negative stories in the press:

Click on the map for a better view in Tableau
Notice first of all that negative stories predominate in the vast majority of states. Maine is an interesting outlier with no negative stories and an early marihuana prohibition (1913). While this probably reflects the few stories from that state in the corpus more than anything of real significance, this is worthy of more research.
Here’s a view of the negative stories at the state level:
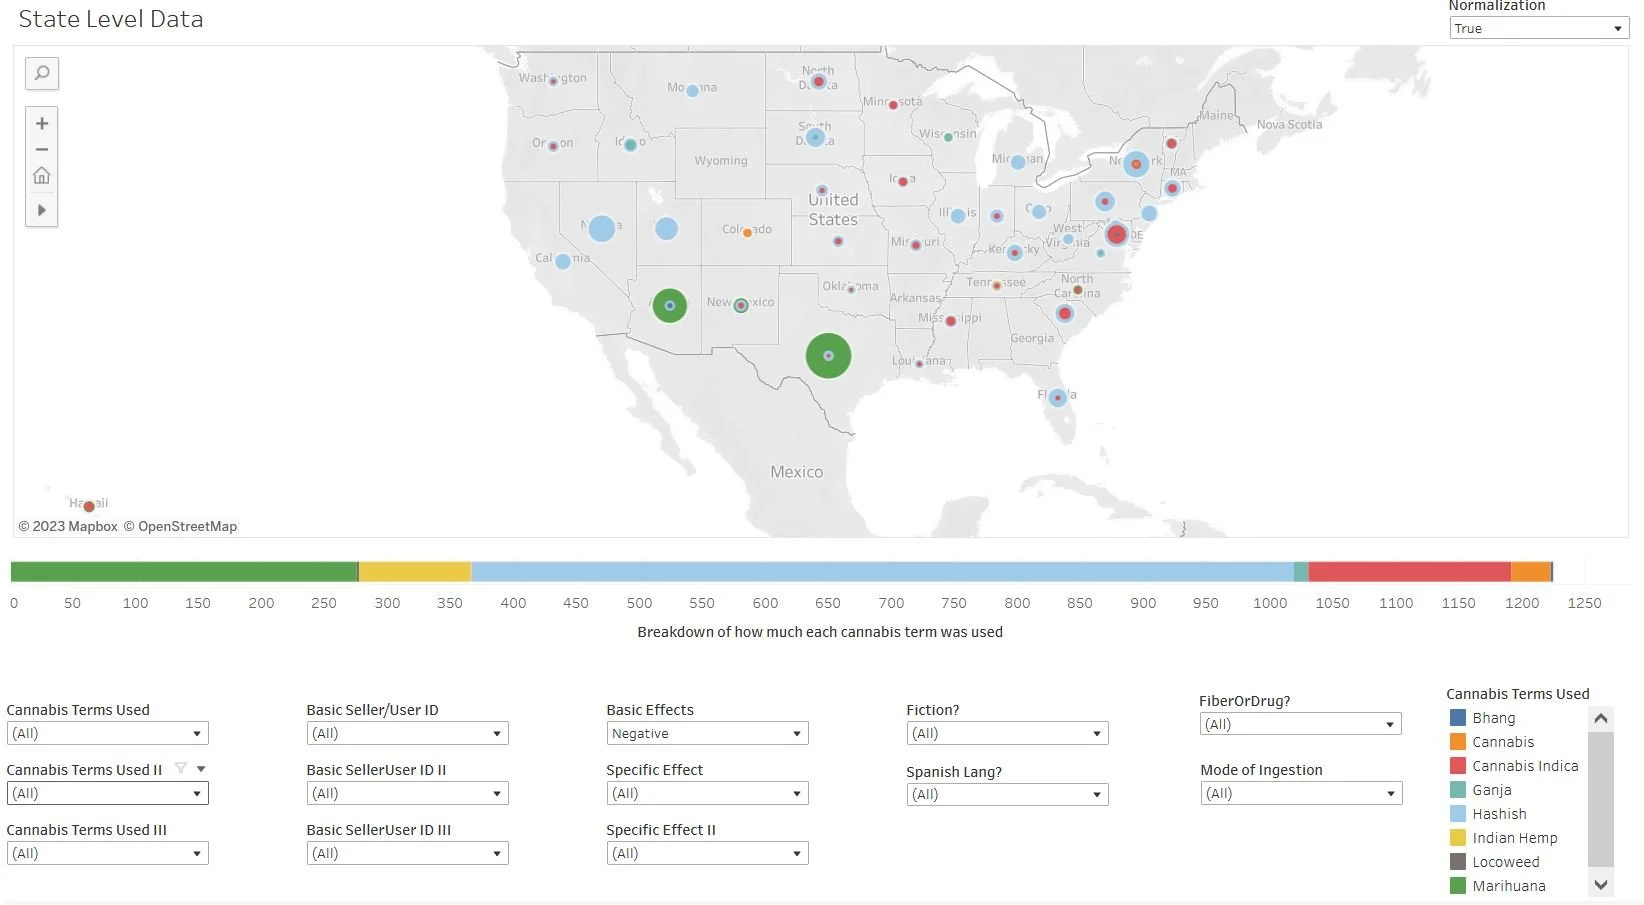
Click on the map to view in Tableau where you can manipulate the variables yourself (user guide here)
And at the city level:
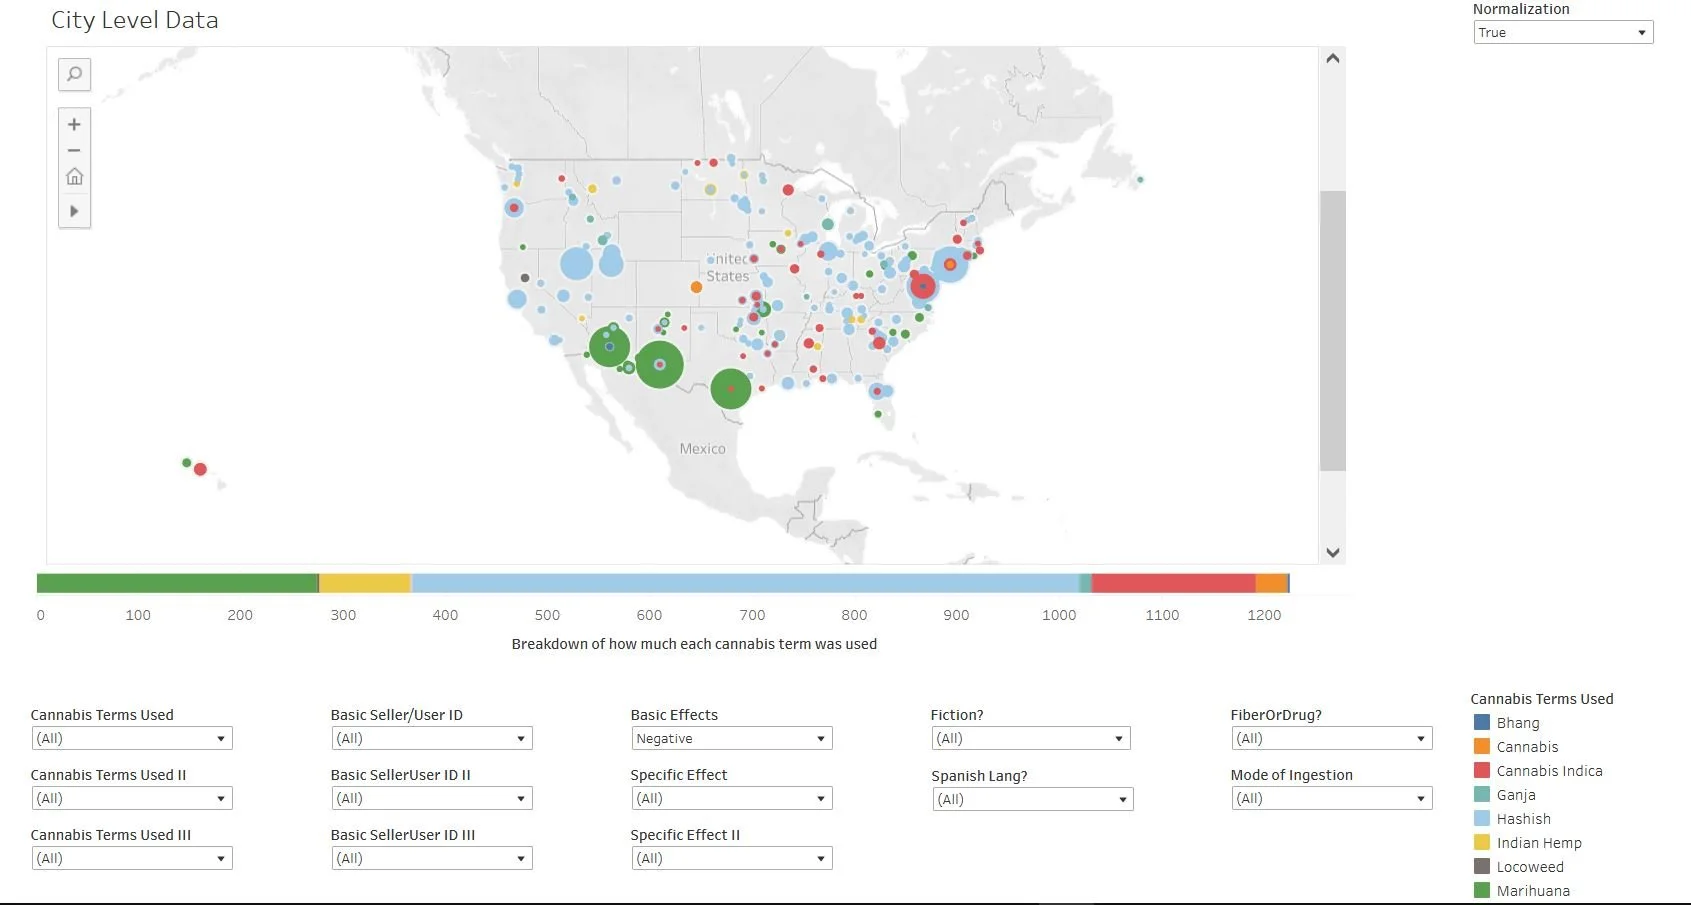
Click on the map to view in Tableau where you can manipulate the variables yourself (user guide here)
Notice that, while there were a few significant hotspots, negative stories about cannabis were published in most of the country. Below we can compare this to the relatively spotty distribution of positive stories (But remember that the size of the dots between the above visualization and the one below are not related. Again, the dots are sized in proportion to the overall numbers in each individual visualization. The ones below are larger than the ones above because there are actually fewer overall positive stories rather than more).
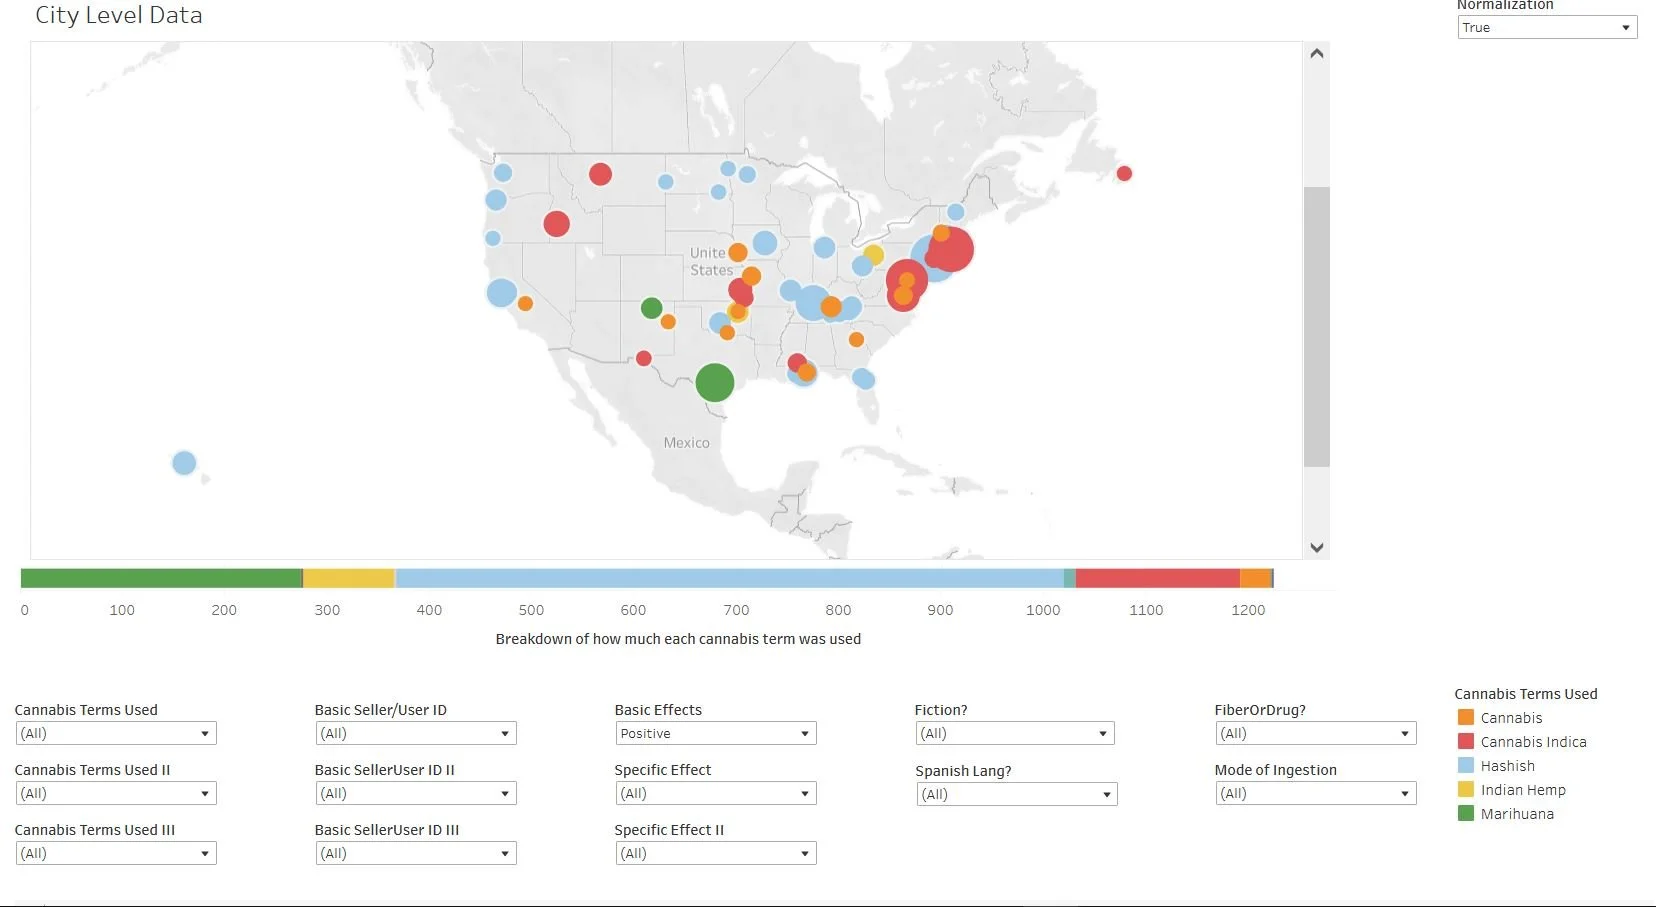
Click on the map to view in Tableau where you can manipulate the variables yourself (user guide here)
Here's a look at neutral stories which, as you can see, are distributed somewhat more widely, but overwhelmingly connected to “hashish.”
Click on the map to view in Tableau where you can manipulate the variables yourself (user guide here)
And, finally, stories that described both positive and negative effects, these being considerably more diverse in their cannabis nomenclature than the “neutral” stories above:
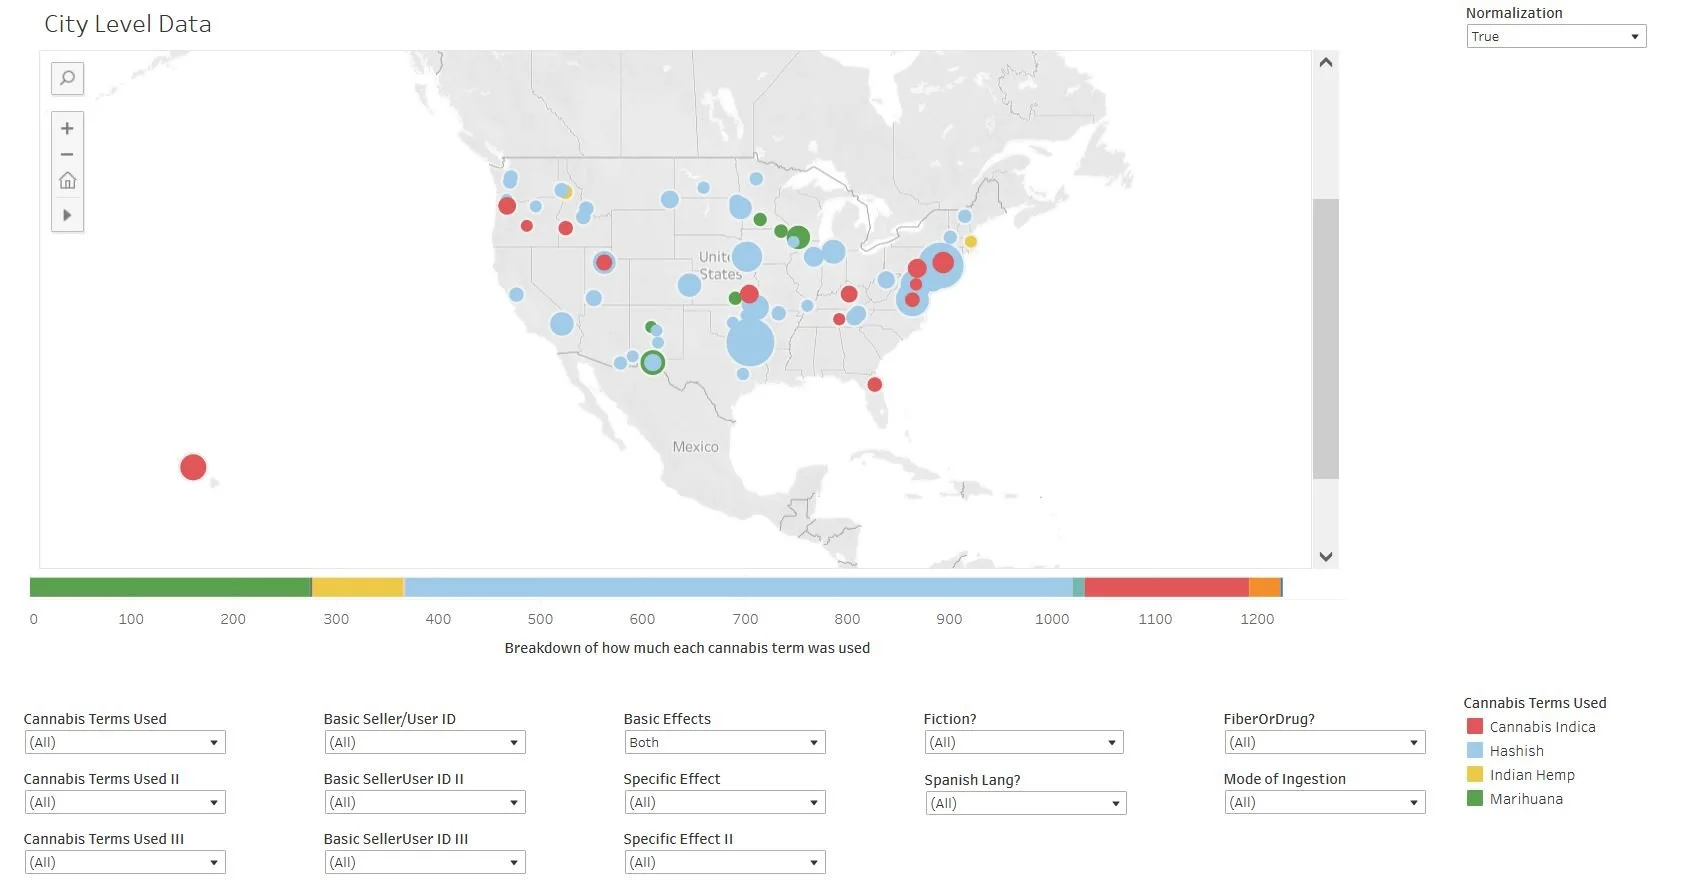
Click on the map to view in Tableau where you can manipulate the variables yourself (user guide here)
Of course we can also look at the specific effects alone. For example, “alt perception,” like stories on “hashish” with which that effect was most commonly linked, appeared quite widely across the country:
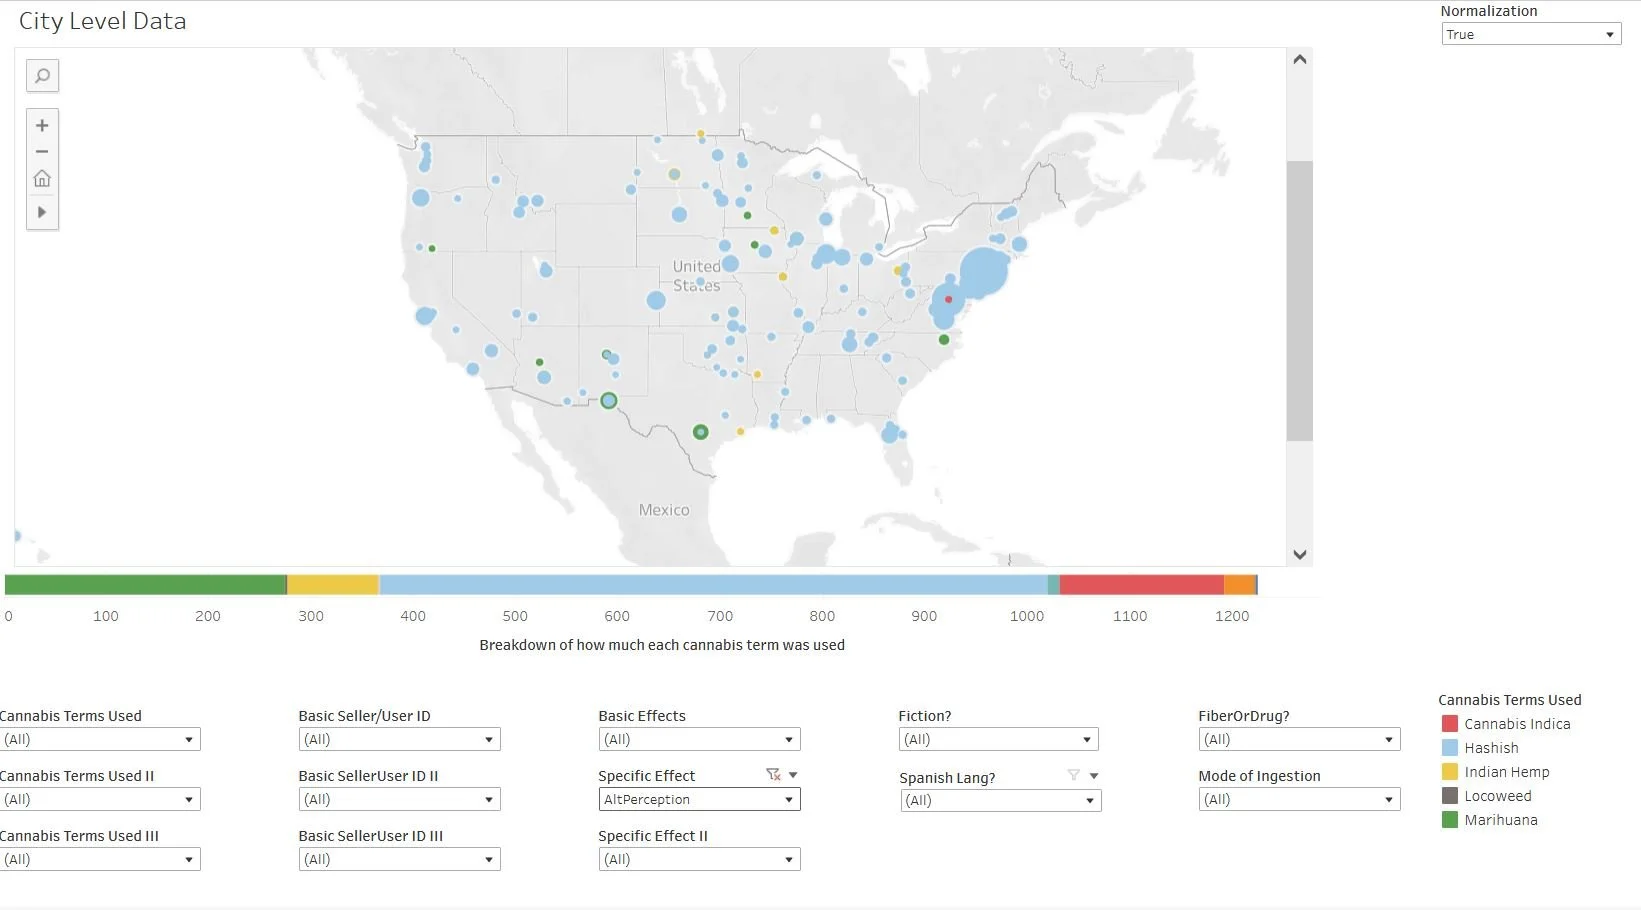
Click on the map to view in Tableau where you can manipulate the variables yourself (user guide here)
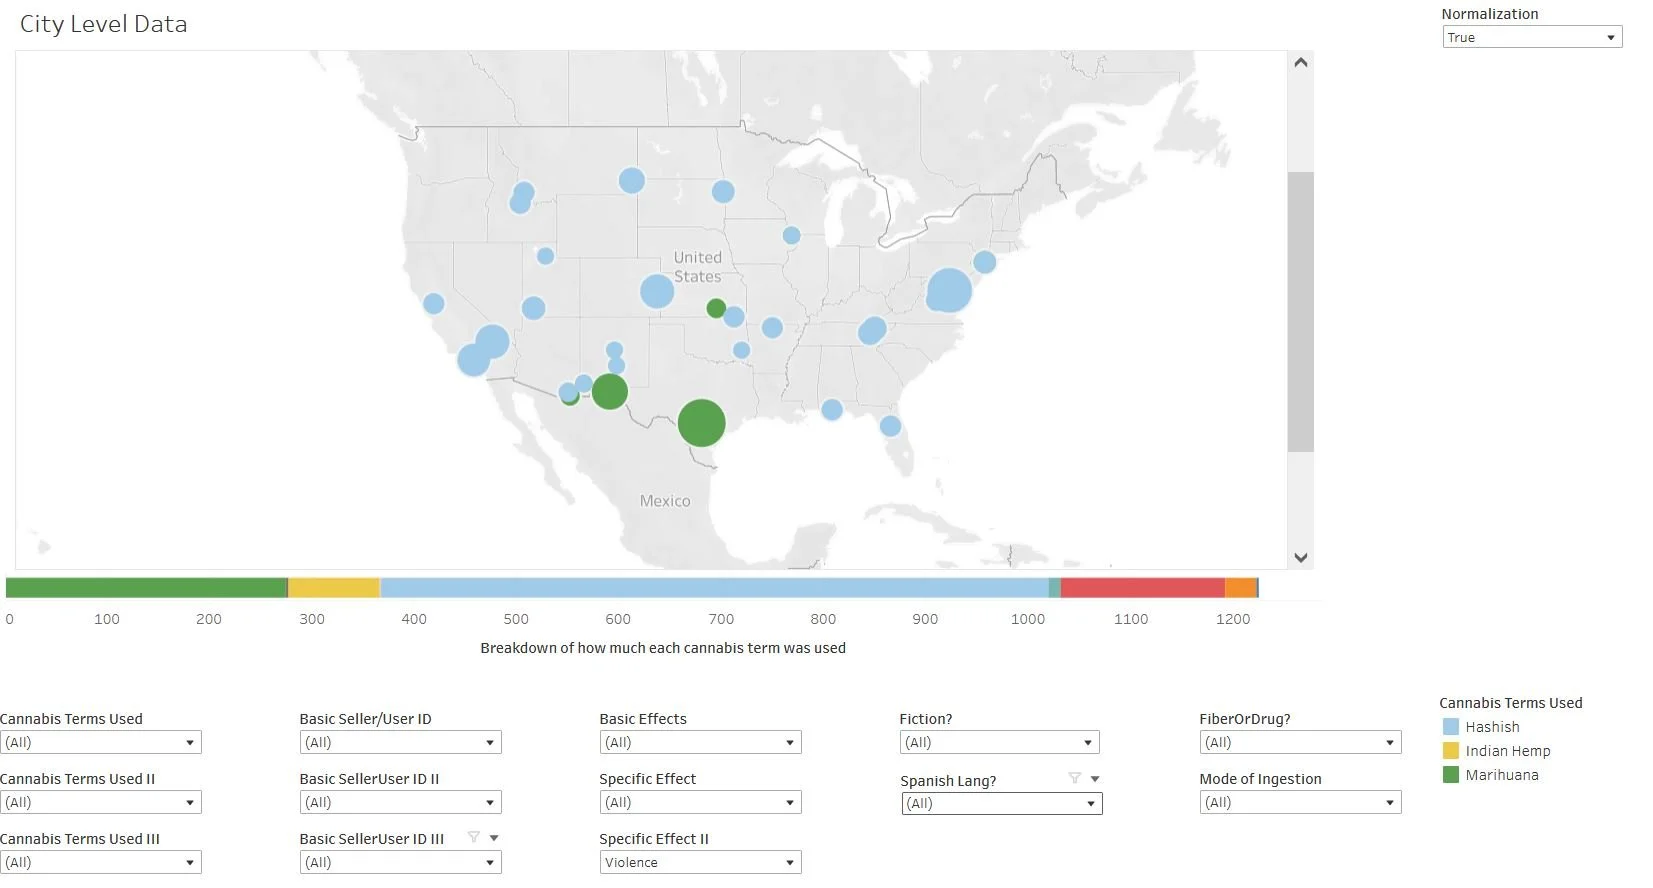
Violence, on the other hand, while still commonly connected to hashish, was also typically linked to “marihuana”:
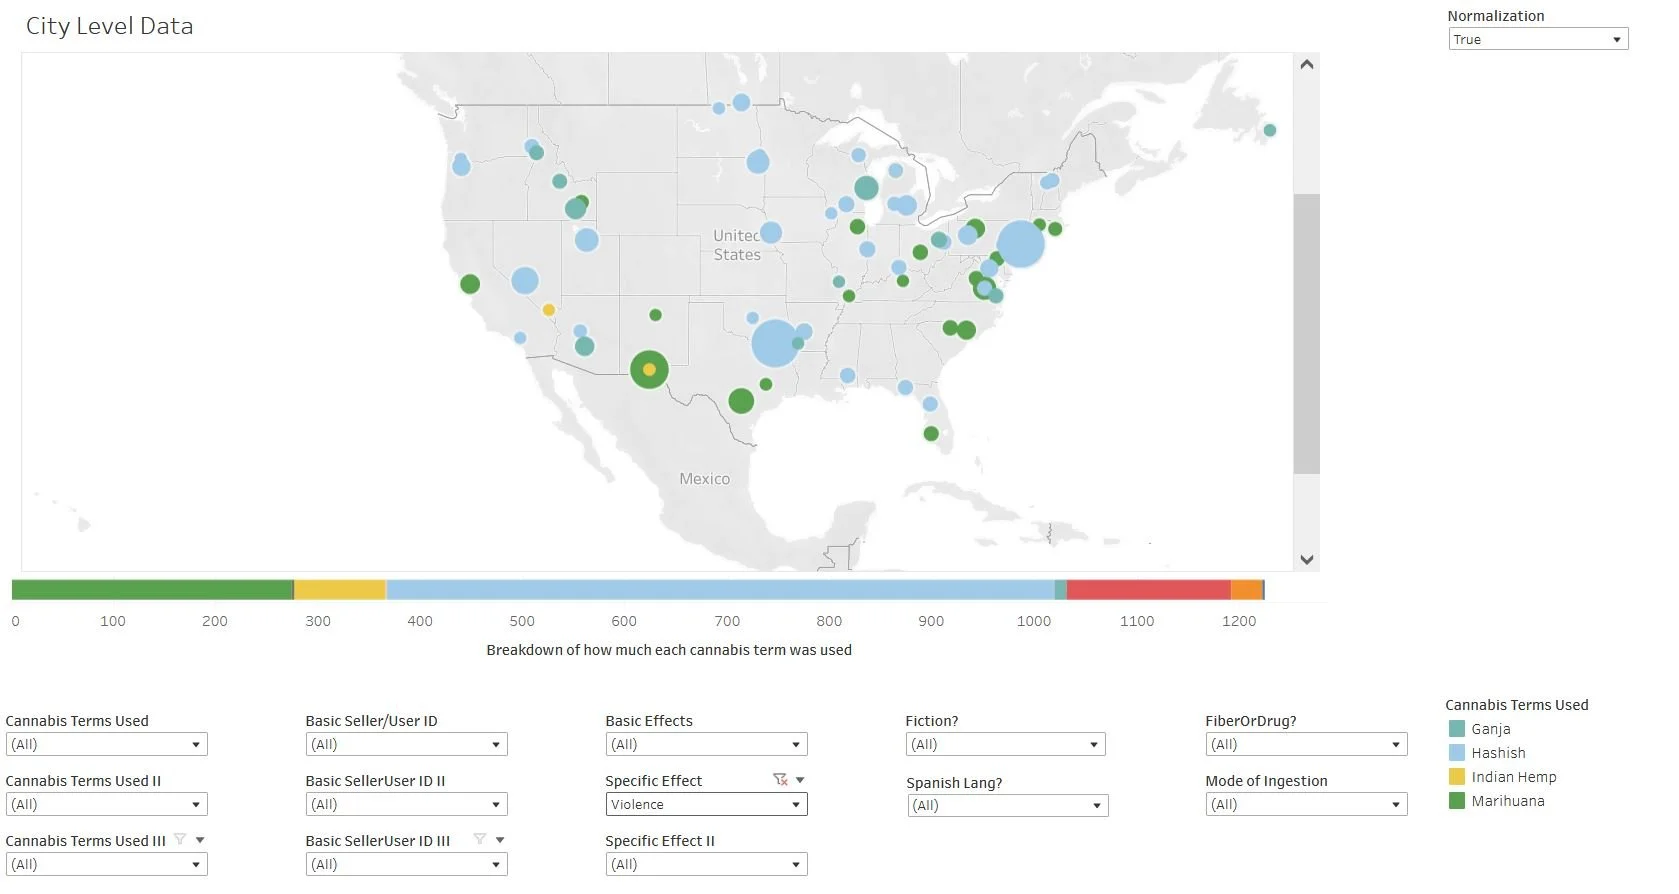
Click on the map to view in Tableau where you can manipulate the variables yourself (user guide here)
Here’s what it looks like when we select violence as our secondary term:
Click on the map to view in Tableau where you can manipulate the variables yourself (user guide here)
Meanwhile “madness” was similarly dispersed though we ended up seeing it more as a secondary term than a primary. We’ll start with the primary references:
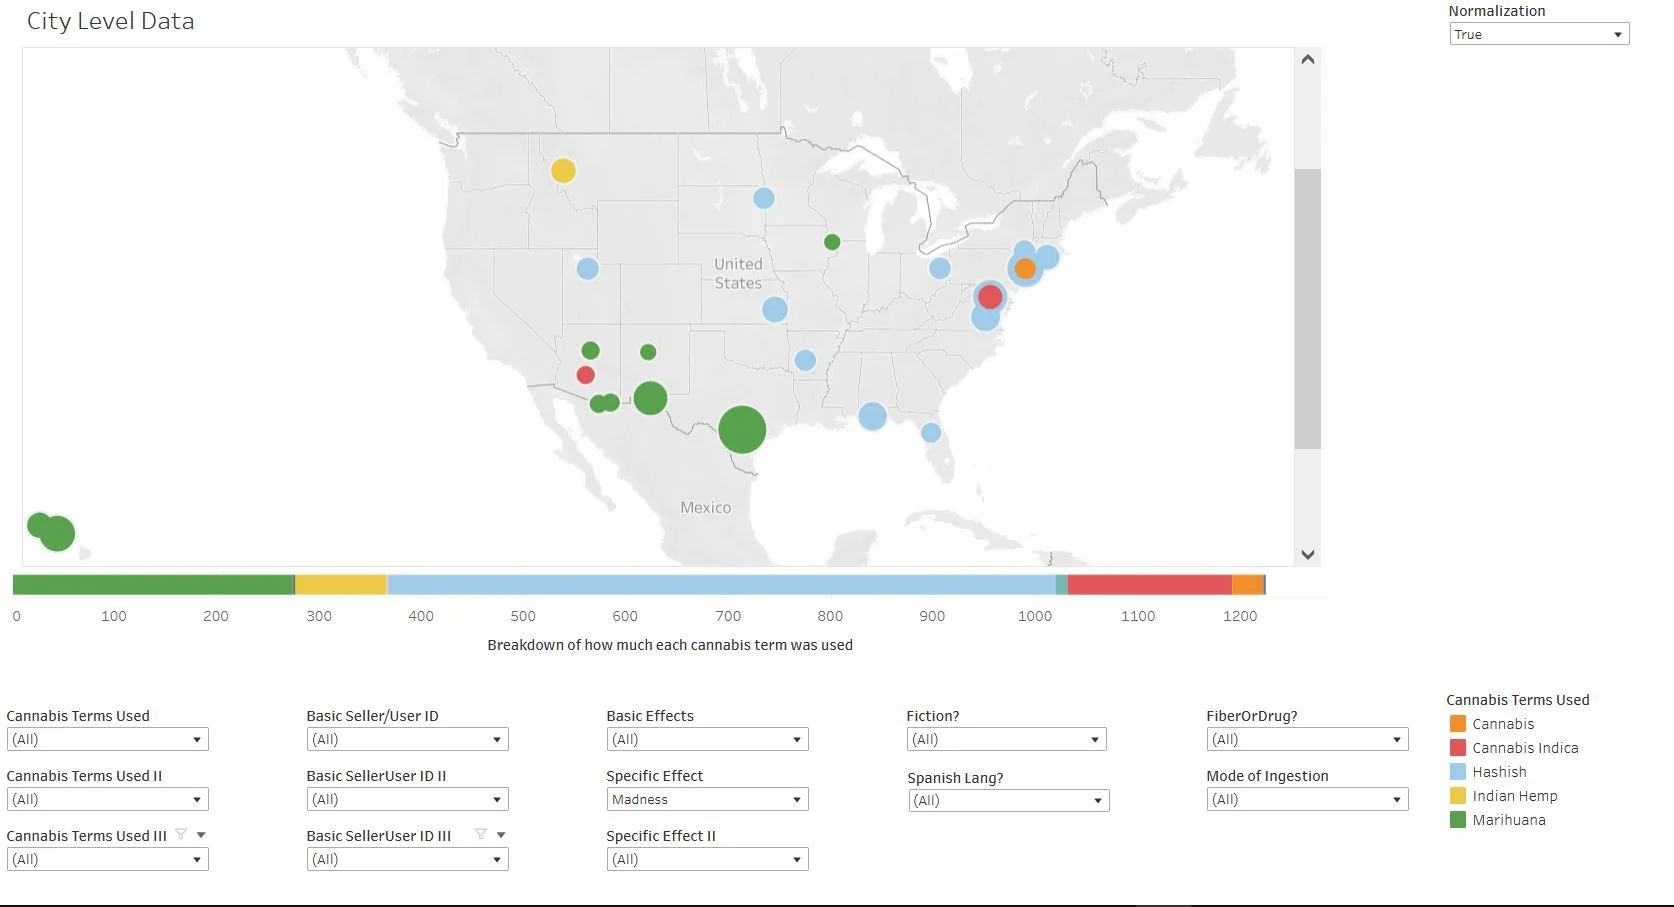
Click on the map to view in Tableau where you can manipulate the variables yourself (user guide here)
And secondary:
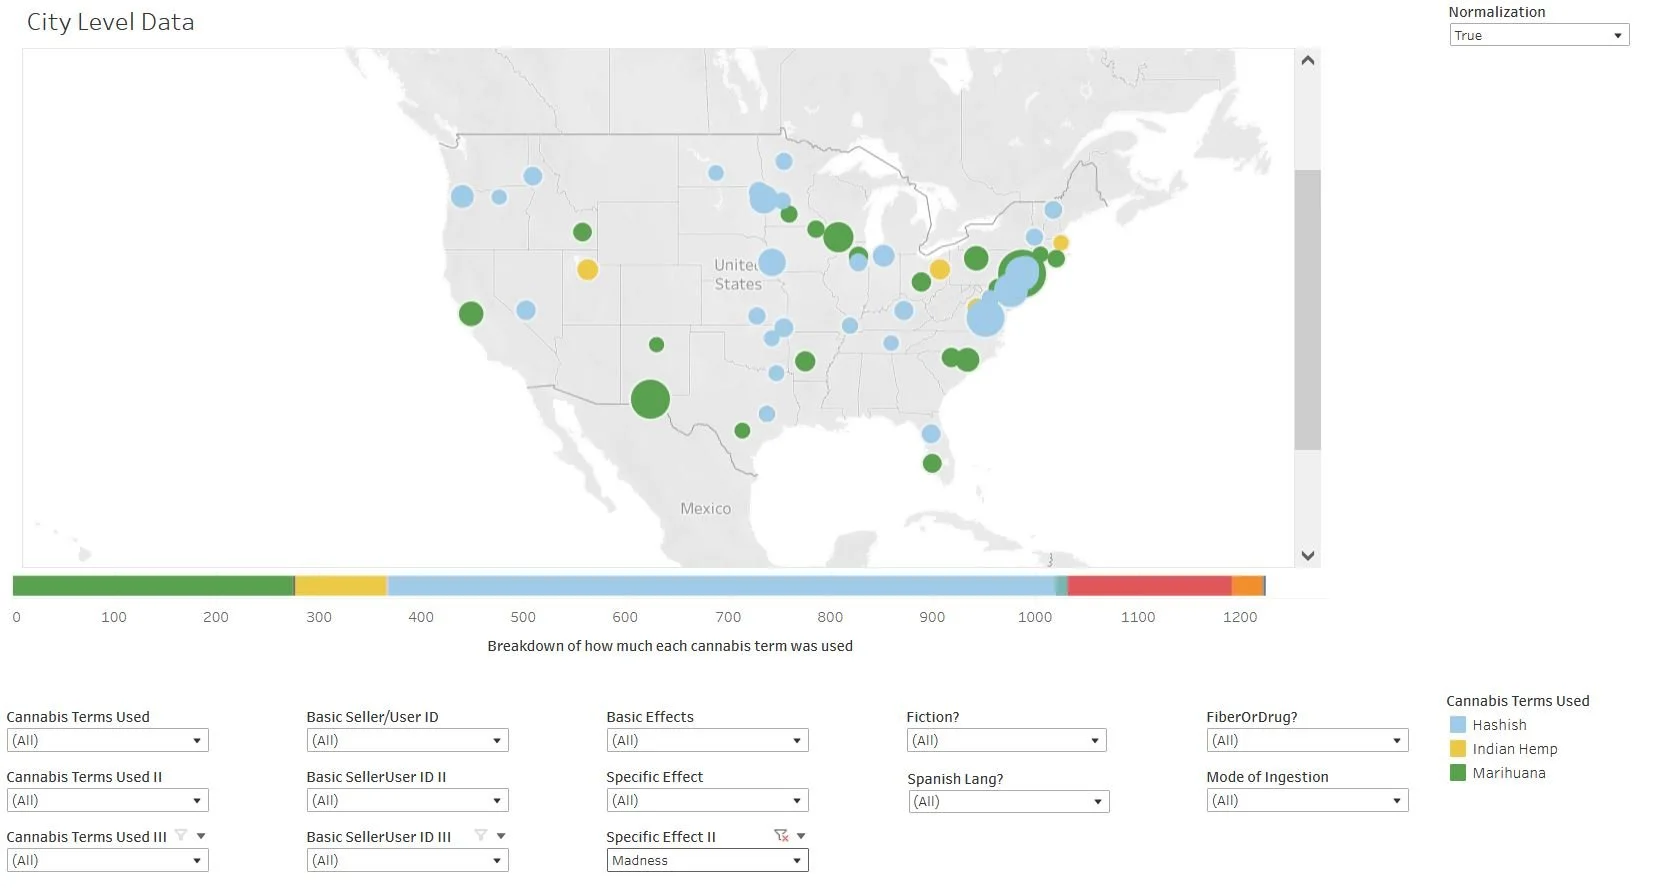
Click on the map to view in Tableau where you can manipulate the variables yourself (user guide here)
Mapping Cannabis Demographics
Given everything we’ve looked at so far, the maps of cannabis demographics will not offer too many surprises. As we would expect given the ubiquity of articles about “hashish,” there were also articles published in nearly all fifty states that associated intoxicant cannabis with “‘Orientals” in the ‘Orient’’:
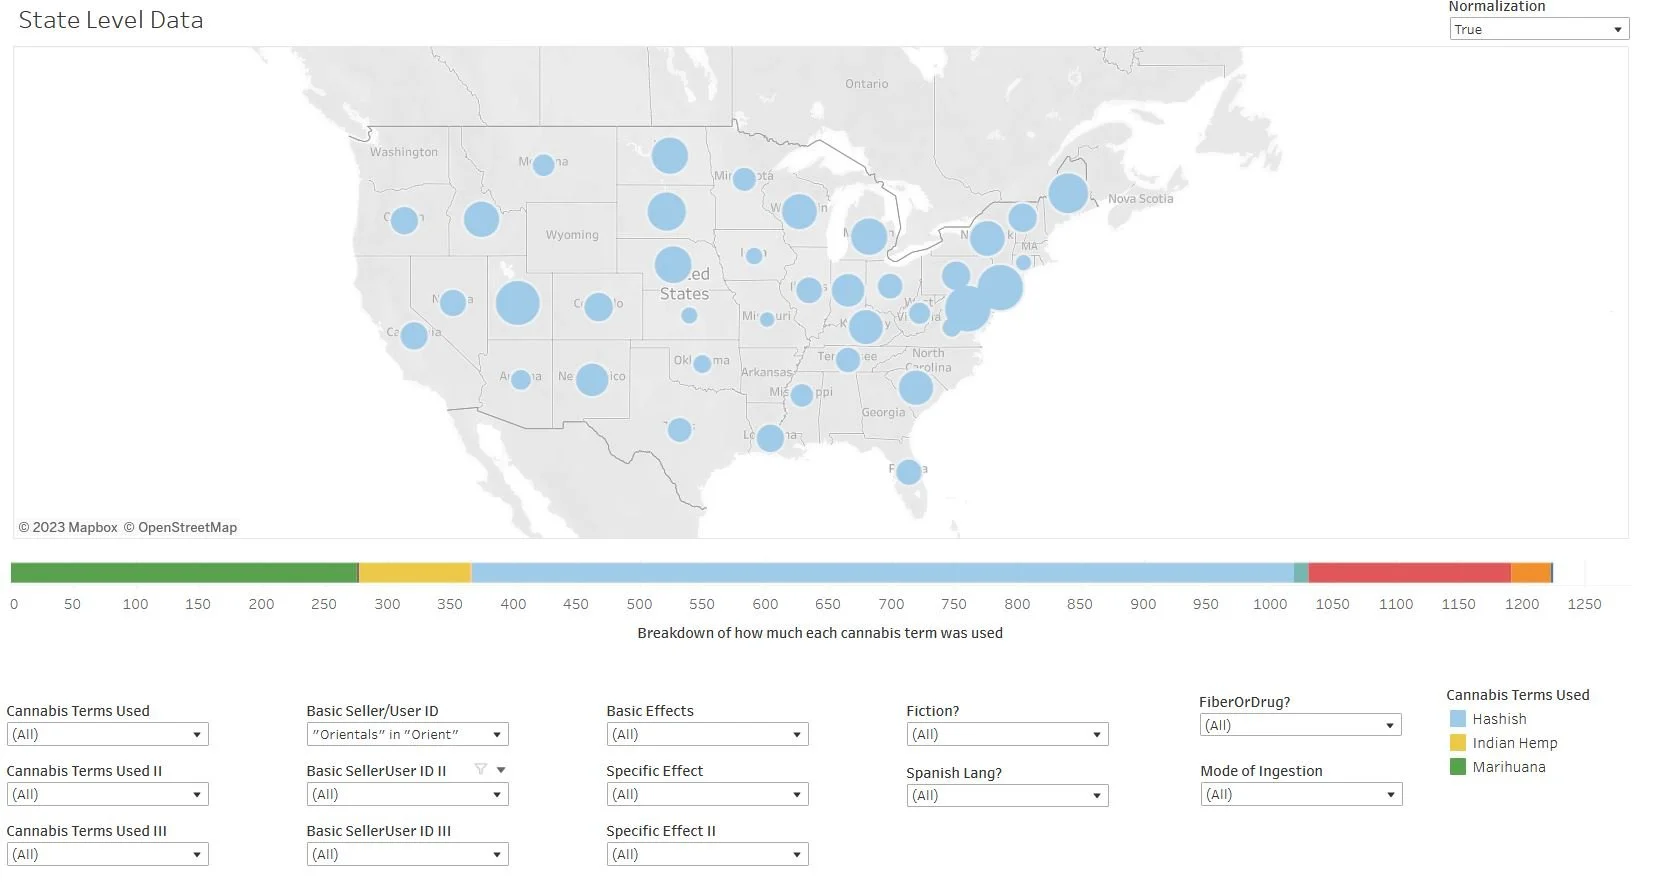
Click on the map to view in Tableau where you can manipulate the variables yourself (user guide here)
And the City-level view:
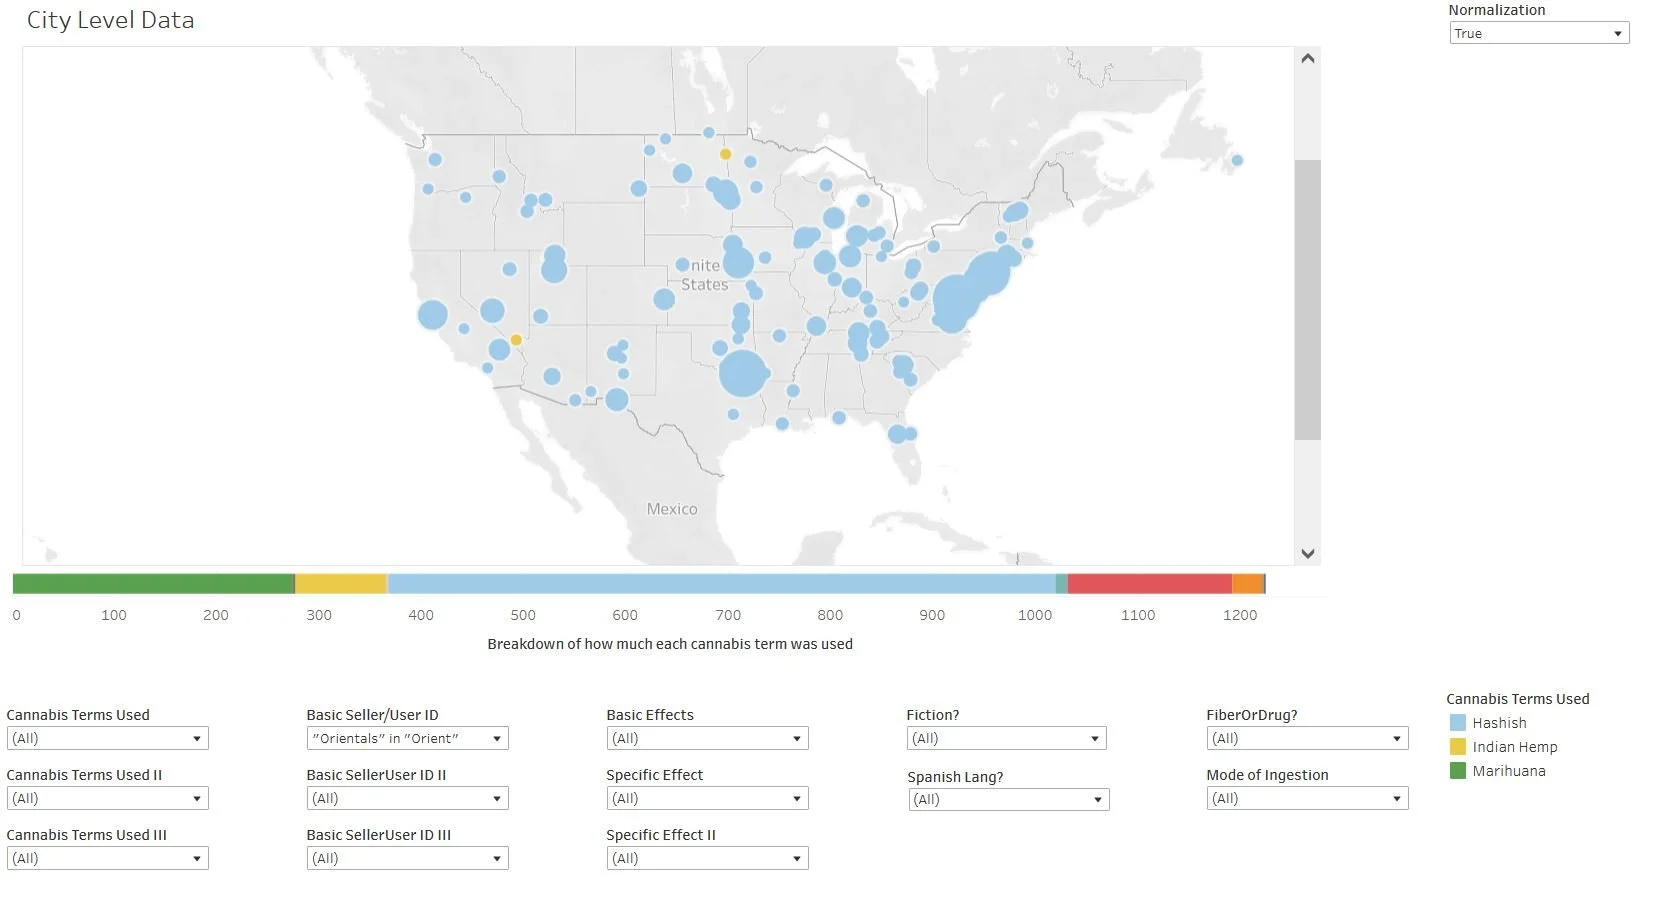
Click on the map to view in Tableau where you can manipulate the variables yourself (user guide here)
The major role of the “Orient” is also obvious when we look at the number of stories involving hashish and “Europeans in the ‘Orient.’” Here’s a look at the state level:
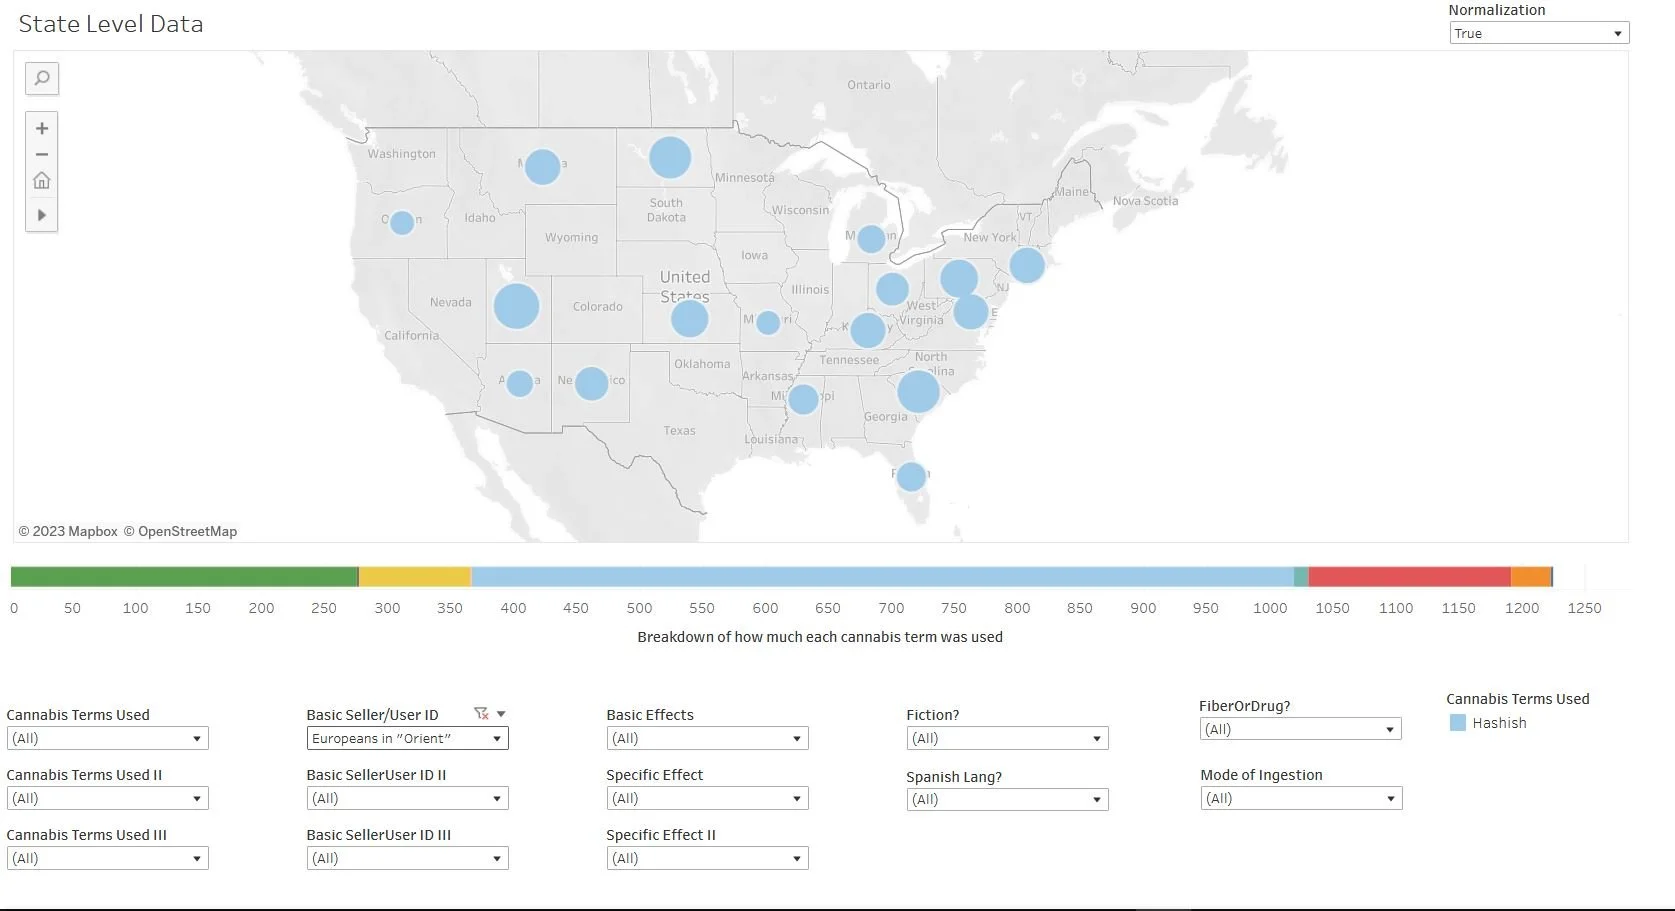
Click on the map to view in Tableau where you can manipulate the variables yourself (user guide here)
And the city level:
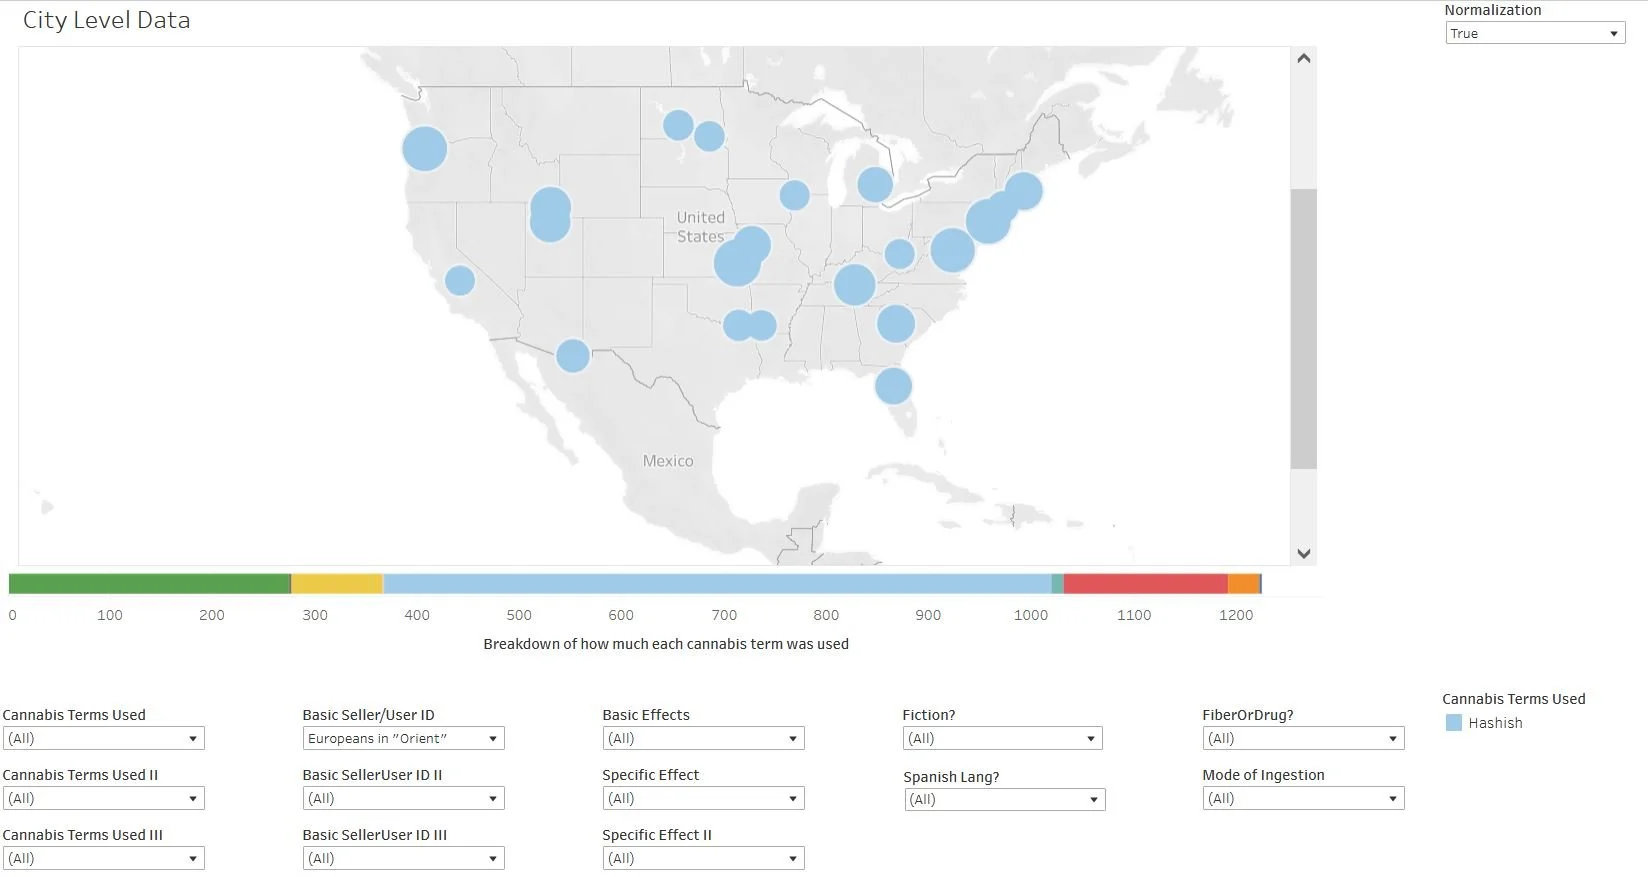
Click on the map to view in Tableau where you can manipulate the variables yourself (user guide here)
This is especially clear if we look at “Basic Seller/User ID II” where a lot of the “Europeans in the ‘Orient’” references ended up categorized. Here’s the state-level look at that:
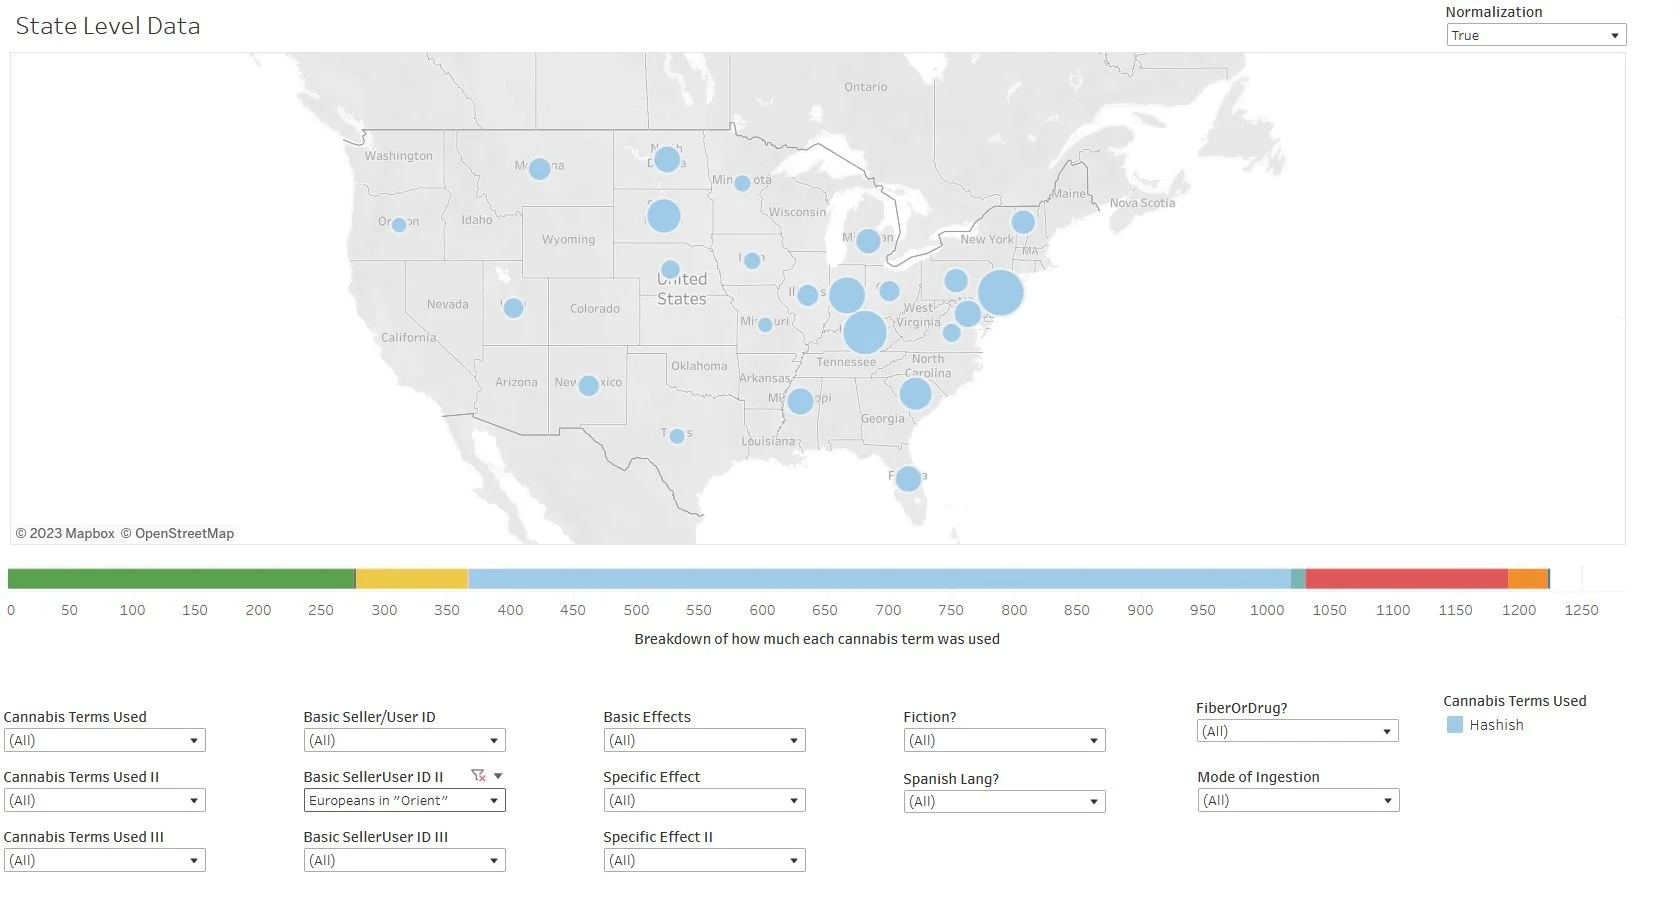
Click on the map to view in Tableau where you can manipulate the variables yourself (user guide here)
And the city-level:
Click on the map to view in Tableau where you can manipulate the variables yourself (user guide here)
The other foreign locale that was likely to be cited was of course Mexico. Here’s a look at the state-level data related to articles that cited “Mexicans in Mexico” as the users or sellers of intoxicant cannabis.
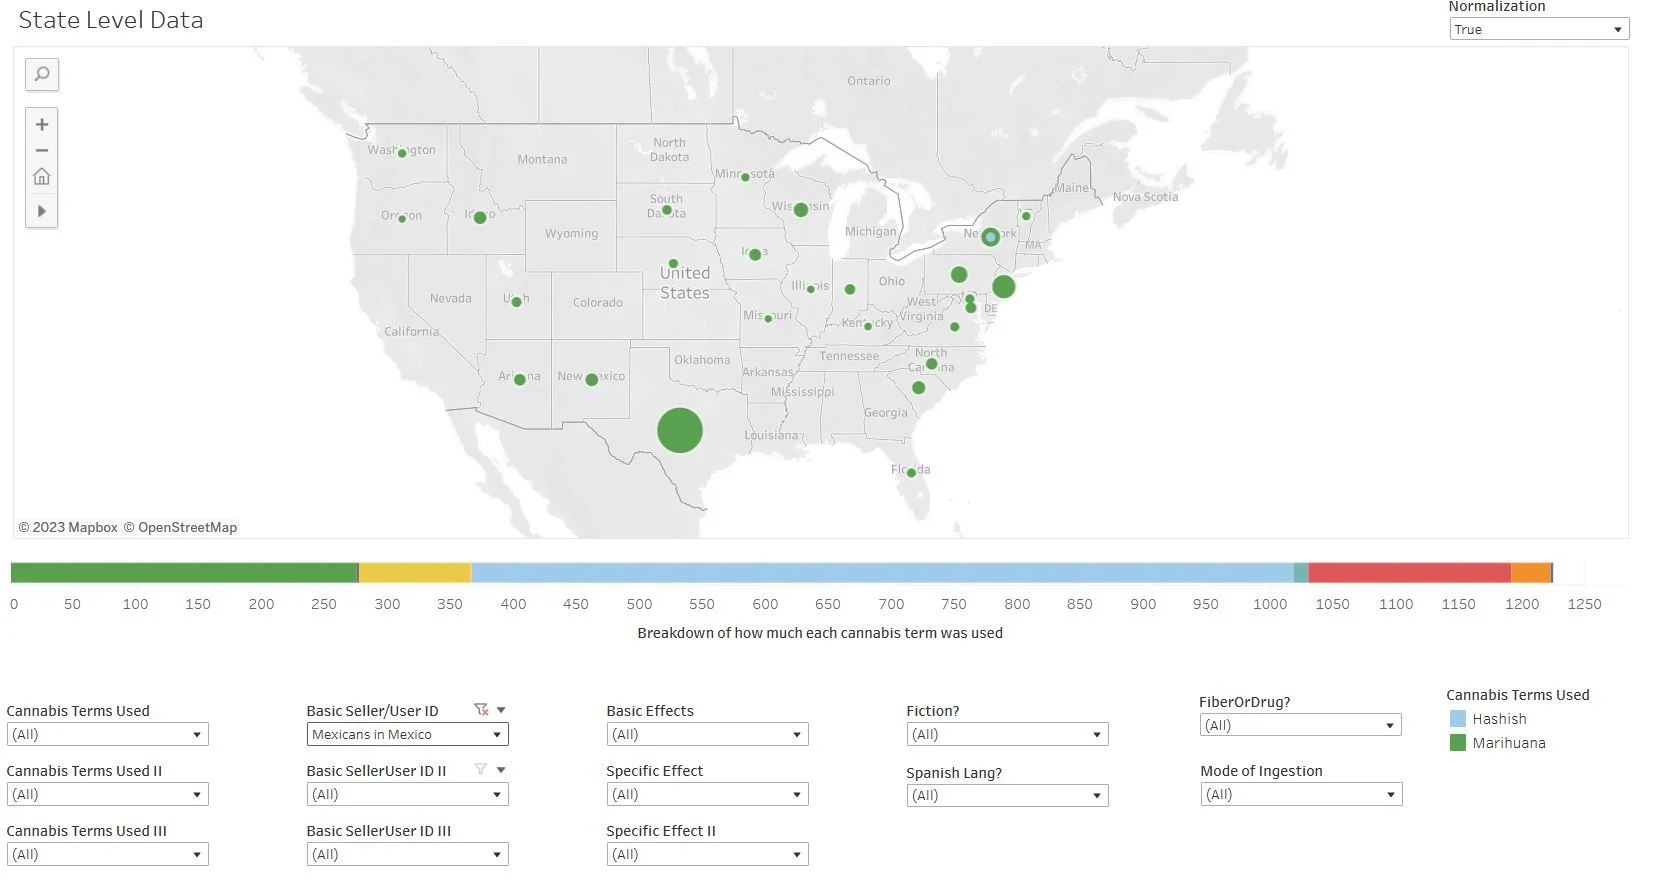
Click on the map to view in Tableau where you can manipulate the variables yourself (user guide here)
And here’s the same look but with Spanish-language sources removed (since San Antonio’s La Prensa’s mission was to cover events in Mexico, it slants the distribution of such stories considerably toward Texas):
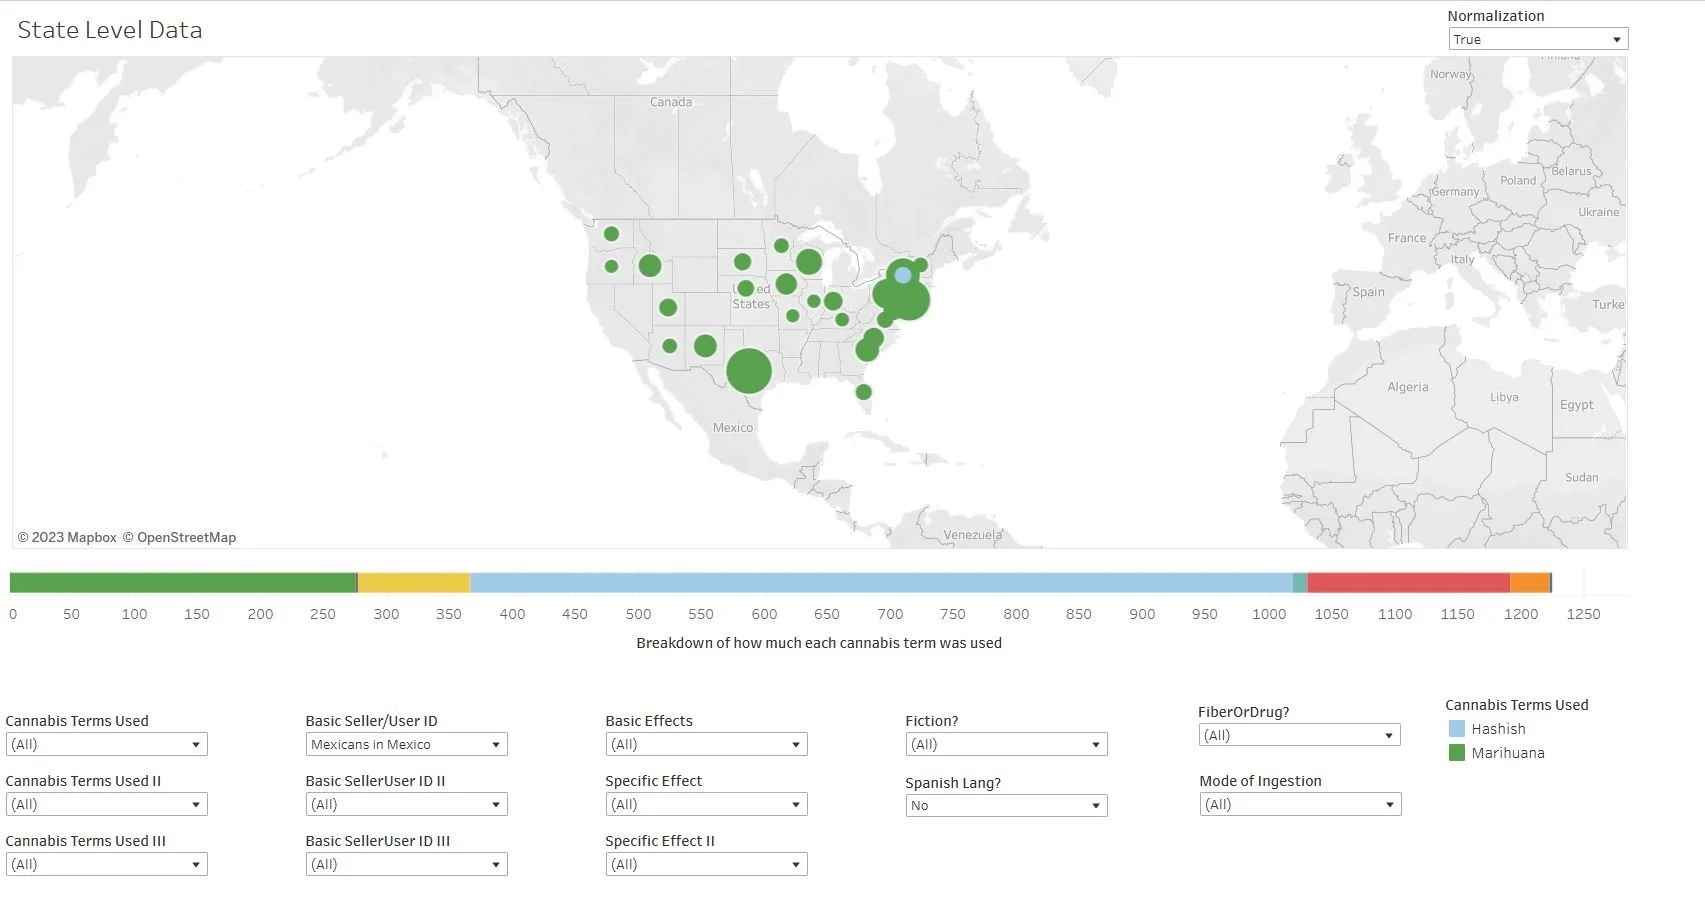
Click on the map to view in Tableau where you can manipulate the variables yourself (user guide here)
It’s important to not overstate the impact of these stories. The actual numbers of articles in each of these states was generally just one or two over the entire decade (you can turn off the normalization toggle to see exactly how many there were in each state). However, the map does indicate that the idea of “marihuana” being something used by “Mexicans in Mexico” was becoming quite widely dispersed. Also keep in mind that there were plenty of other sources out there beyond the newspapers available in this corpus. Clearly these ideas were beginning to spread nation-wide by the 1910s.
Here's a city-level view of “Mexicans in Mexico” with the Spanish-language press removed:

Click on the map to view in Tableau where you can manipulate the variables yourself (user guide here)
What about “‘Mexicans’ in the U.S.”? This of course is a crucial question for the historiography, as Bonnie and Whitebread argued that marijuana legislation followed in the wake of Mexican immigration. Though the timing of the legislation does not really follow that pattern: Massachusetts’ banned the drug in 1911, Maine, Wyoming, Indiana, and California in 1913; Vermont and Utah in 1915; Colorado and Nevada in 1917; Rhode Island in 1918; Texas in 1919.
Here’s a look at our state-level data on “‘Mexicans’ in the U.S.”:
Click on the map to view in Tableau where you can manipulate the variables yourself (user guide here)
And here are “‘Mexicans’ in the U.S.” as the secondary demographic category (but remember not to be fooled by the size of the dots. Most of them represent just one or two articles over the course of the decade).
Click on the map to view in Tableau where you can manipulate the variables yourself (user guide here)
Here’s a look at the city-level with “‘Mexicans’ in the U.S.” as the primary demographic category:
Click on the map to view in Tableau where you can manipulate the variables yourself (user guide here)
And secondary:
Click on the map to view in Tableau where you can manipulate the variables yourself (user guide here)
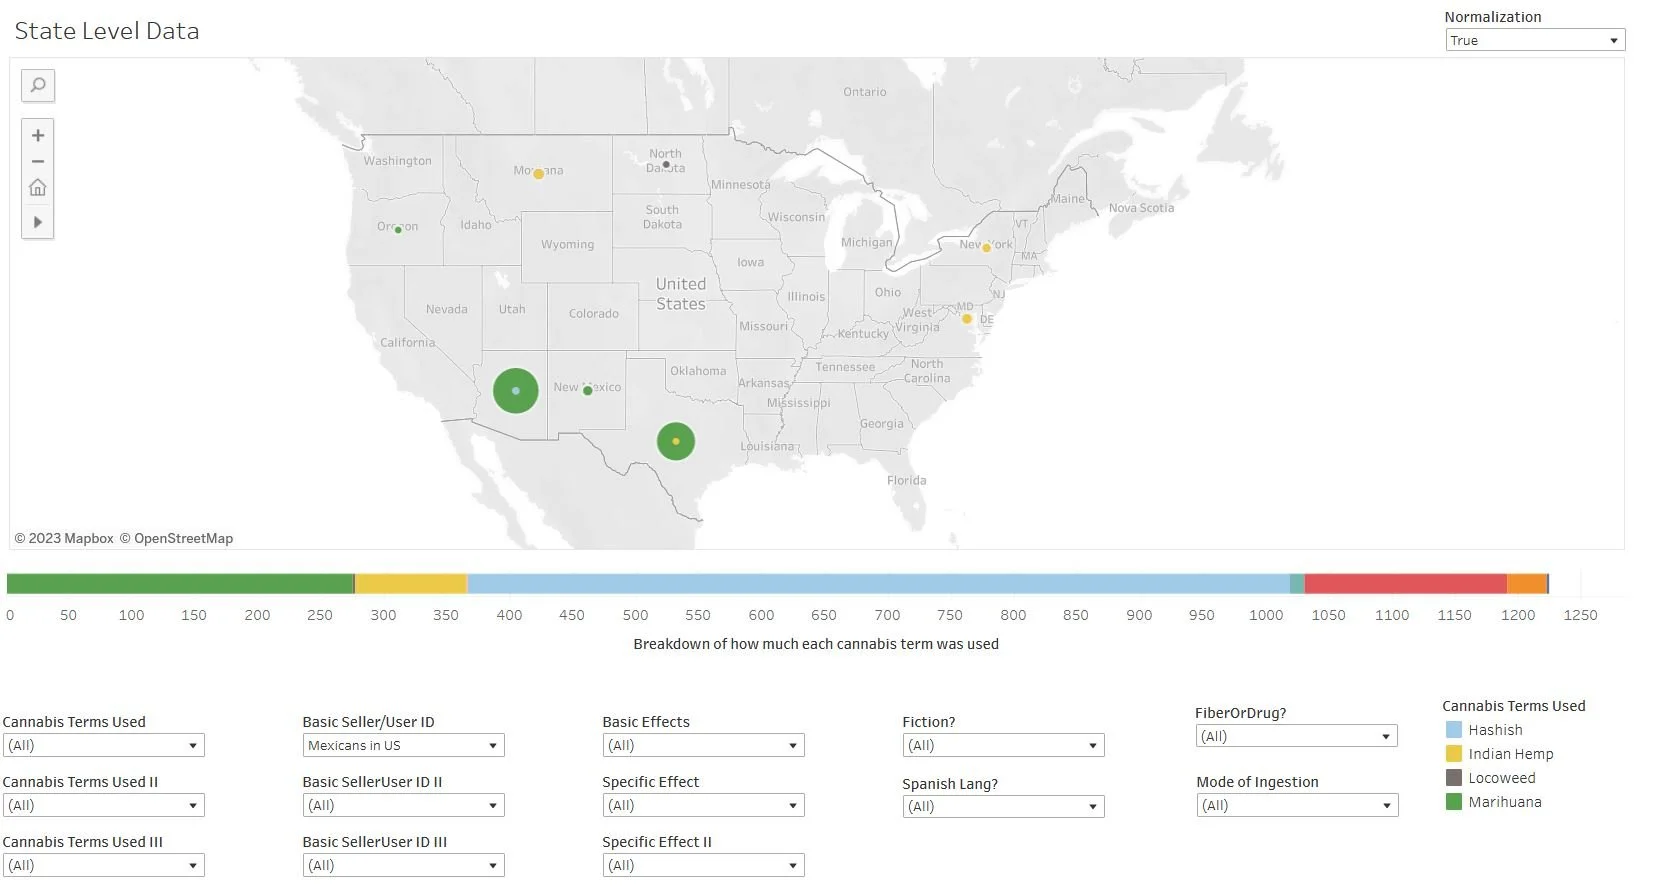
While there is some overlap with states that banned cannabis, the only real “hotspots” that stand out are, as we’ve already seen, Texas and Arizona. It is quite interesting that while Arizona did not have a particularly high number of stories about Mexicans in Mexico using marijuana, that state had a disproportionately high number of stories about Mexicans in the U.S., many of those involving arrests for marijuana-law violations.
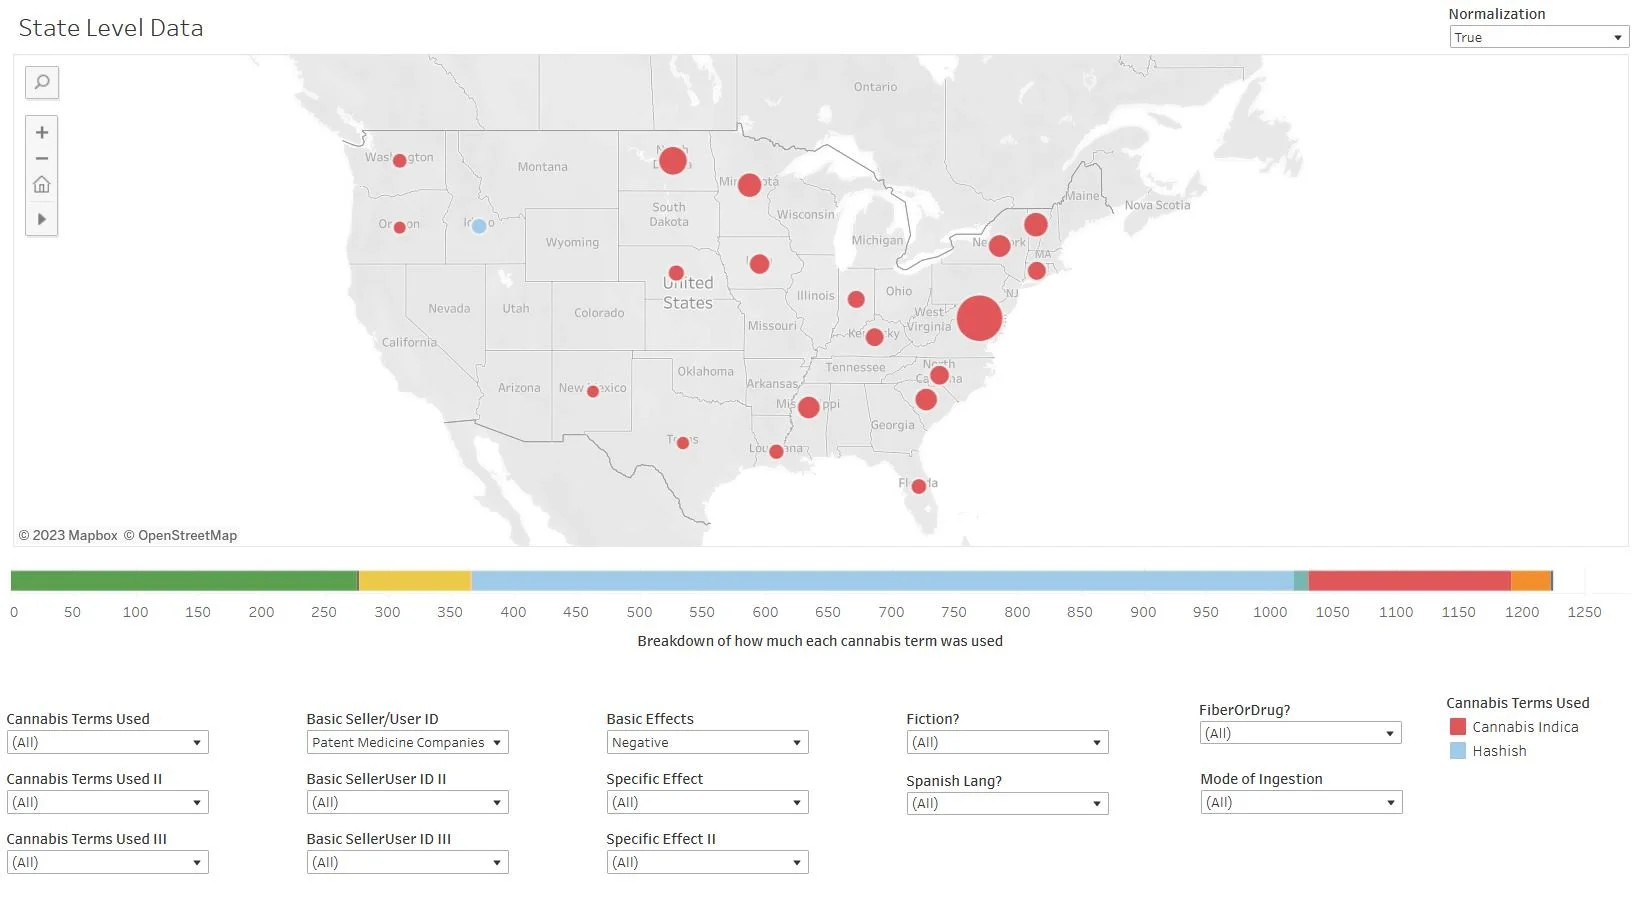
In short, the association with recent Mexican immigrants and marijuana appears to have been very real in Texas and Arizona, both states where there was a lot of anxiety about Mexican immigration. But there was a lot of anxiety about drugs throughout the country that was helping inspire new drug regulations. Perhaps the most telling example of this is if we look at the articles that cited “patent medicine companies” as the source of cannabis. Such companies, which sold secret remedies often made with dangerous ingredients, had been a central node of concern in the United States about habit-forming drugs throughout the Progressive Era. Here’s a look at the state-level data where the sellers were identified as “Patent Medicine Companies.”
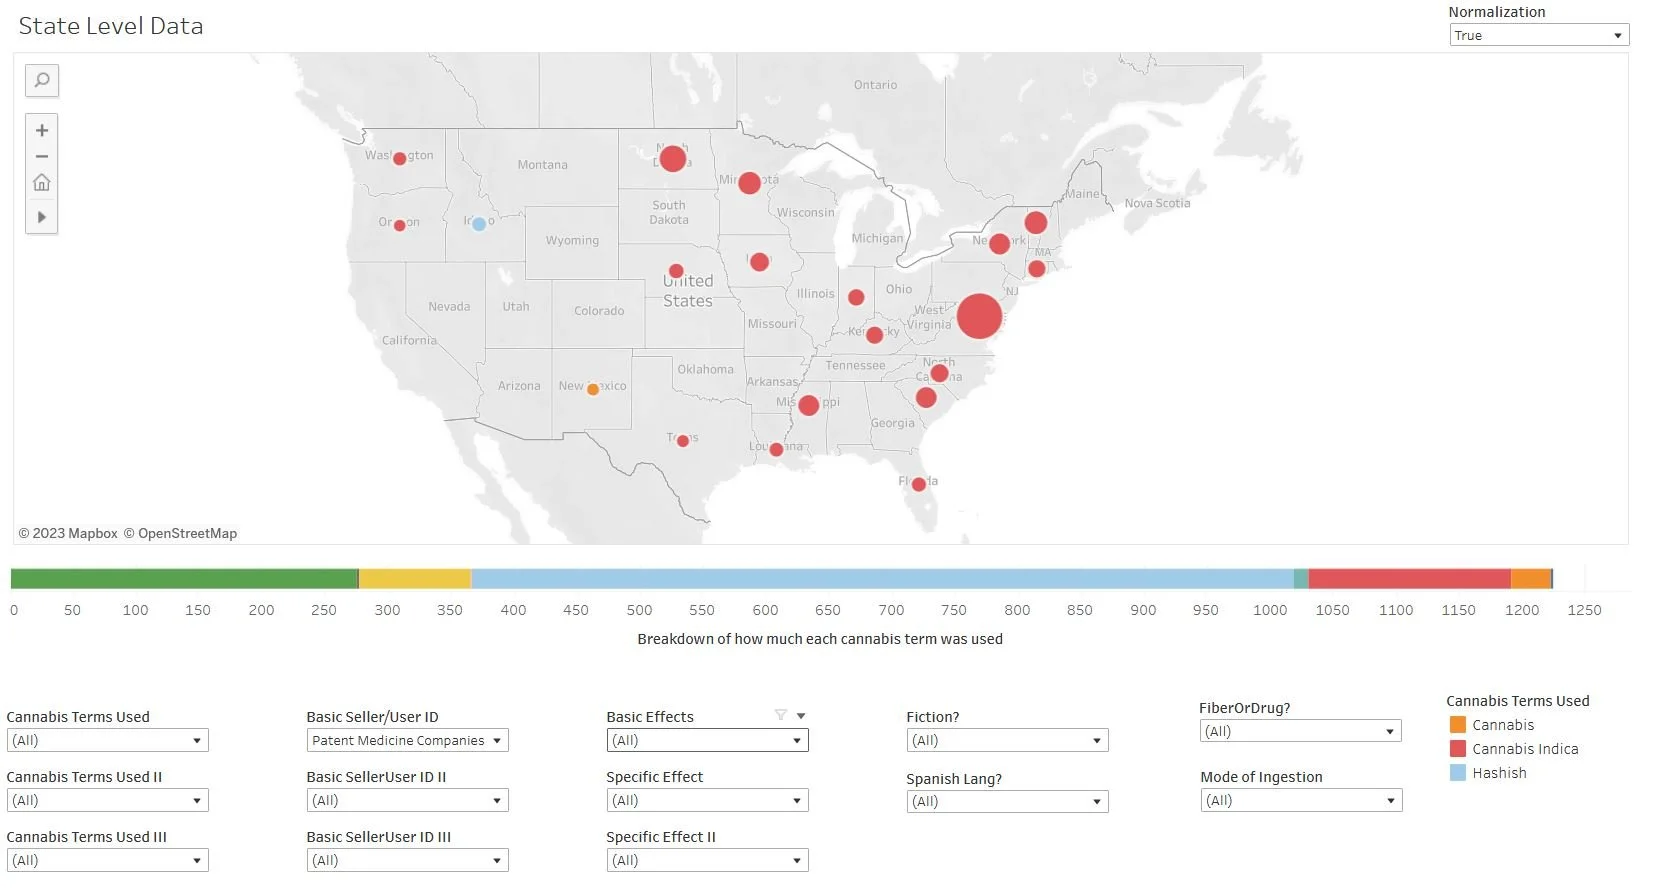
Click on the map to view in Tableau where you can manipulate the variables yourself (user guide here)
Notice they are overwhelmingly associated with the word “cannabis indica.” But we can also see that this discourse was essentially all negative if we look at the same map but only the stories with “negative” portrayals of the drug’s effects:
Click on the map to view in Tableau where you can manipulate the variables yourself (user guide here)
If you didn’t notice a difference, you got the point. This discourse was essentially all negative and a major inspiration for reformers who were calling for new drug regulation.
In short, the data here backs the trend in the historiography toward understanding cannabis prohibition in the U.S. as stemming from far more than racism against Mexican immigrants. While the “Mexican hypothesis” may still be valid for a few locations, there were various other sources of concern about cannabis, from long-established negative discourses related to “hashish,” to cannabis as a potentially dangerous ingredient in patent medicines, to sensationalistic Mexican discourses about madness and violence that began crossing the border well in advance of the major waves of Mexican immigration that began in the 1910s.
Mode of Ingestion
Finally, it’s worth considering how the newspapers portrayed the way people ingested cannabis. As I noted in my SHAD piece on the “Mexican hypothesis” (see especially pp. 17 and 26), one glaring question about cannabis’ U.S. history is why use of the drug didn’t become more widespread earlier than it did. Cannabis was well known as an intoxicant since the middle of the nineteenth century, and while portrayals of its effects were often quite negative, they sometimes also suggested that these could be quite marvelous and enjoyable. Yet prior to the 1910s, there is very little evidence of recreational cannabis use in the United States beyond some very small pockets that we might classify as “experimentation.” Adam Rathge’s first couple of chapters are especially good on this. One hypothesis is that the drug never caught on because, prior to the early twentieth century, the most common means of ingesting this substance was to swallow an often very large dose, something that we now know often leads to unpleasant overdose. Smoking, on the other hand, allows users to more easily control their dosage, and, indeed, smoking seems to have become the preferred mode of ingestion as use of the drug began to spread in the early twentieth century. Smoking of course was the classic mode of ingestion in Mexico, so we might conjecture that the biggest influence that Mexico had on this history was technological—the technology of smoking— and that influence did not require the presence of immigrants as much as the presence of stories from Mexico about this drug. Though there are potentially other explanations. During the early twentieth century numerous sources claimed that people were taking up cannabis use because other drugs, including alcohol, had been banned.[3] And it could of course be a combination of these factors.
We did take note where possible of the mode of ingestion cited in each of our newspaper stories. Most of them did not include this detail, but enough did that we might at least look at the data. Before we look at the map, a quick chart that shows how few of our stories actually included this information:

Click on the image for a better view in Tableau
783 of our 1,225 stories did not mention the mode of ingestion. Of the 442 that did, swallowing was cited 44% of the time (196 stories), smoking 39% (173), “both,” which meant both swallowing and smoking, 7% (29), through the skin in the case of “corn cures,” 9% (40), and then a couple of outliers claiming it was taken by “injection,” and in the case of one fictional story, someone being drugged when a “hashish-drenched cloth” was put over their face.
Here's a look at how the smoking and swallowing stories broke down by cannabis nomenclature:

Click on the image for a better view in Tableau
While “marihuana” was the single term with the most “smoking” references, with 64 of 173, or about 40% of the total, that obviously leaves 60% of the smoking references to other nomenclature. Clearly there were other sources than Mexican marijuana for the idea that this drug might be smoked rather than taken orally. Our map provides a different look at the same data.
First, at the state-level:
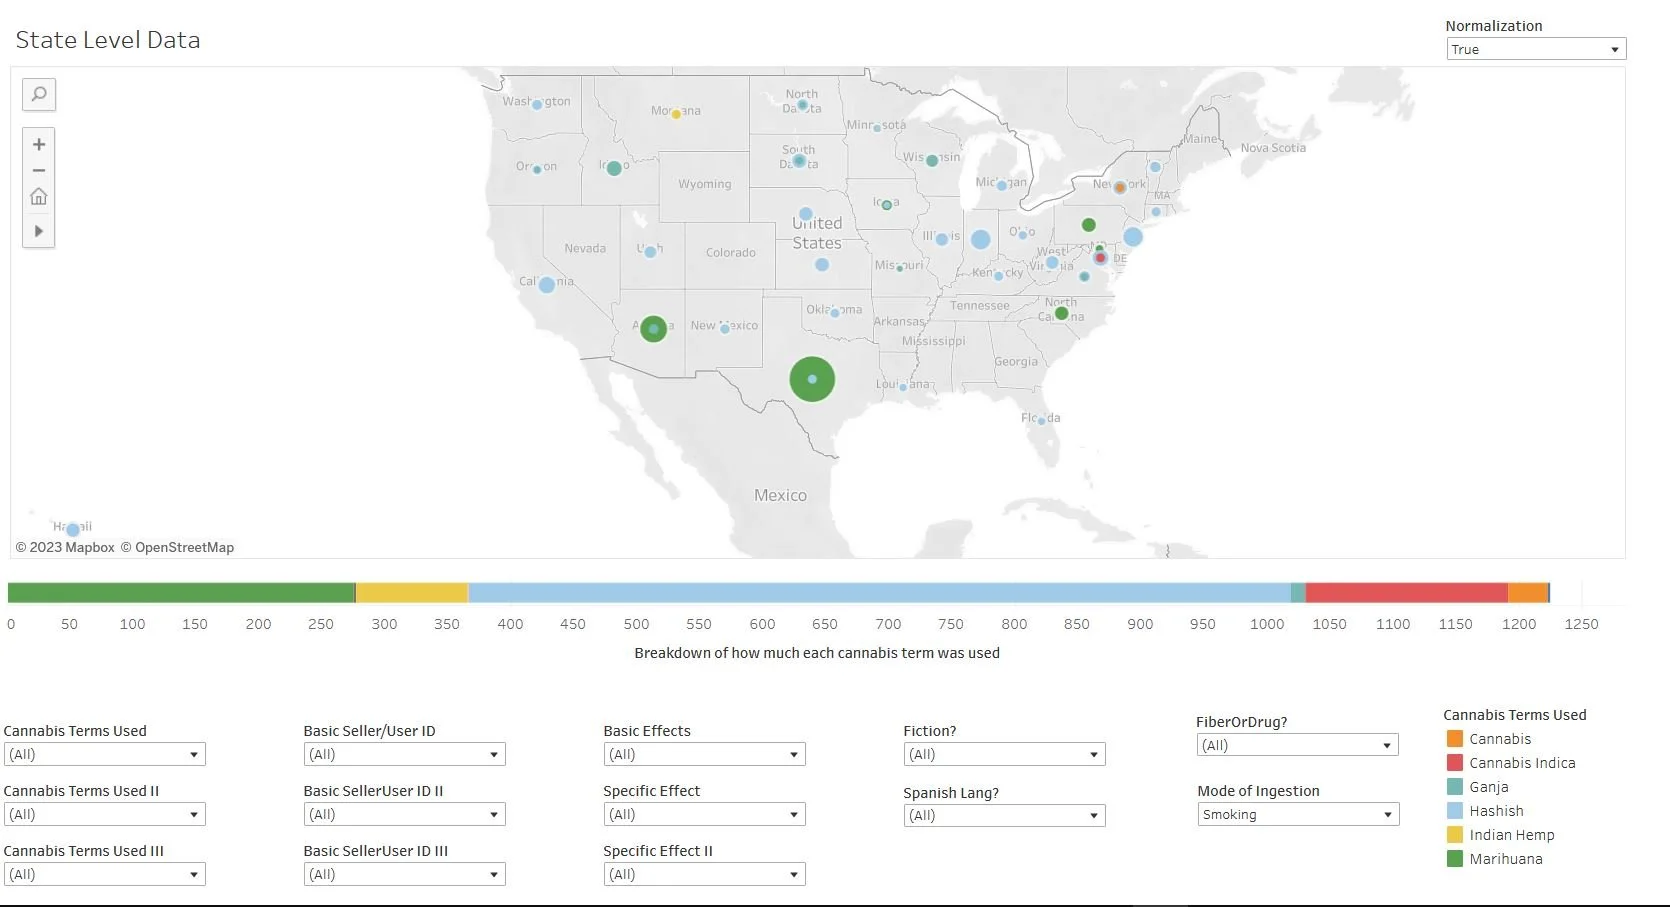
Click on the map to view in Tableau where you can manipulate the variables yourself (user guide here)
Here’s the same view with the Spanish-language sources removed:
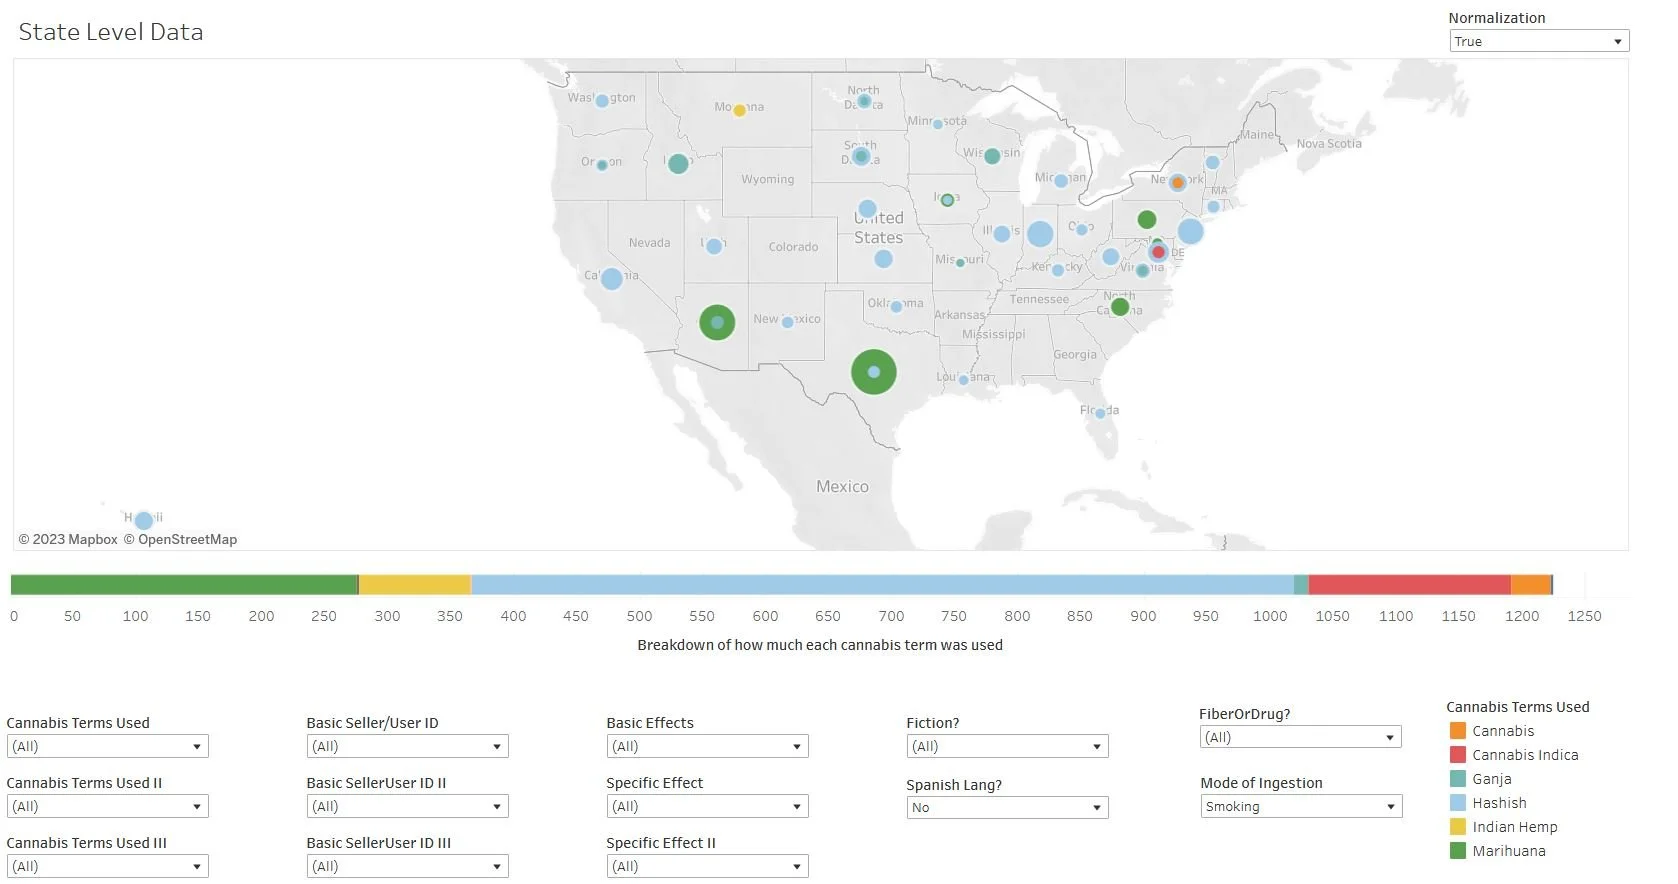
Click on the map to view in Tableau where you can manipulate the variables yourself (user guide here)
And now at the city level, first with the Spanish included:
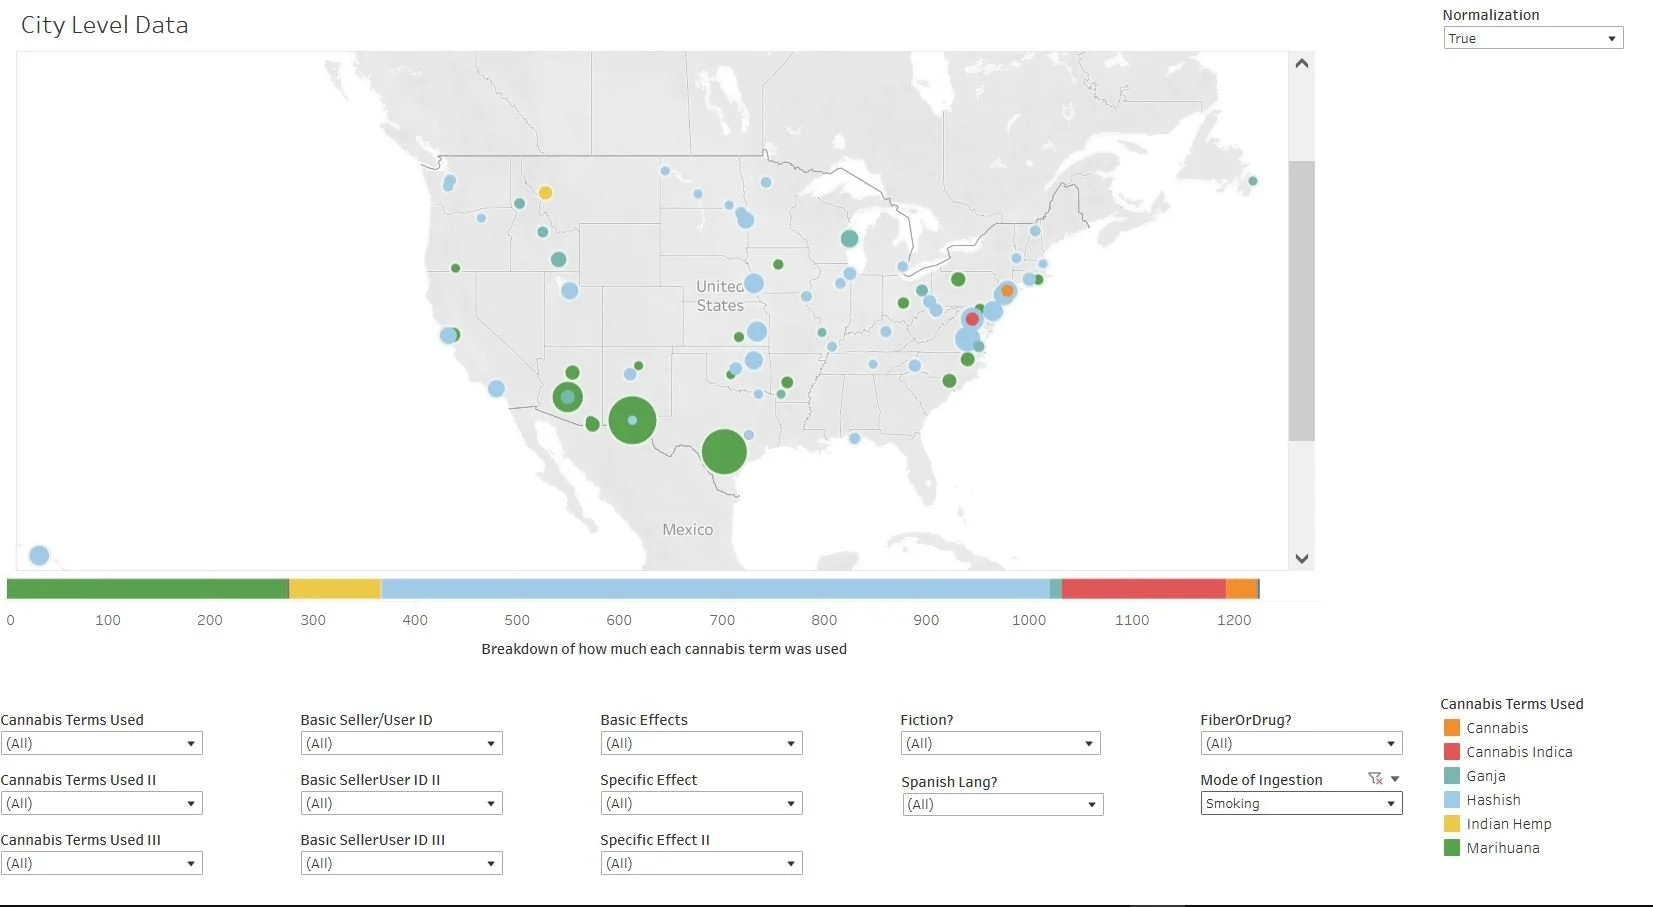
Click on the map to view in Tableau where you can manipulate the variables yourself (user guide here)
And now with the Spanish excluded:

Click on the map to view in Tableau where you can manipulate the variables yourself (user guide here)
Certainly the hotspots for stories on smoking marijuana were in Texas and Arizona. However it’s quite interesting that stories about smoking cannabis were published in much of the country, often related to the word “hashish.”
That said, stories about swallowed cannabis were not only more numerous but more evenly distributed, as we can see here at the state level:
Click on the map to view in Tableau where you can manipulate the variables yourself (user guide here)
And more clearly at the city level:
Click on the map to view in Tableau where you can manipulate the variables yourself (user guide here)
In short, smoking clearly was not only known along the border where the word “marihuana,” Mexican immigrants, and stories from Mexico about marihuana were most common. Thus if the emergence of smoking was a key factor in the apparent expansion of cannabis use during this period, it may have been inspired by Mexican custom, but there were plenty of other sources that suggested this mode of ingestion as well.
Before we conclude, it is worth mentioning one glaring absence from the geographic data— Louisiana. While Adam Rathge has shown that cannabis, and the word “marihuana,” was a major presence in the New Orleans Times Picayune during the 1920s, there is not a single reference to “marihuana” in the corpus for Louisiana during the 1910s, and only 12 total articles on drug cannabis for the whole state, despite there being more than 11,000 newspaper issues for that state during the decade. It could of course be that cannabis did not begin to appear in the papers till the 20s, but it seems more likely that this reflects Chronicling America’s sample from Louisiana which leaves New Orleans underrepresented. Unfortunately, back in 2019 when we finished collecting our data, we did not count up how many newspaper issues were available for New Orleans versus the rest of the state. But today’s Chronicling America collection, which probably is not radically different, has only about 700 issues available for New Orleans during the 1910s. That’s a significant number, but only about 6% of the total available for the state. It’s very likely that this dearth of New Orleans publications held back in 2019, for we only had one total cannabis article from New Orleans itself. I suspect that, as with Texas and Arizona, concern about, and perhaps even the use of recreational cannabis, was overwhelmingly concentrated in specific urban areas rather than widely dispersed. Drug cannabis’ early history in the U.S. may thus be more of an urban history than has previously been recognized. But that will require further research to verify.